What on earth is DataOps?
A few years ago, IBM provided some insane statistics - 90% of the world’s data was produced in the last two years! This means many of the traditional methods of data pipelines aren’t well-equipped to deal with big data. The speed and quantity of data production now means there needs to be an automated and data-driven approach to deal with data.
DevOps vs DataOps
Many years ago, a similiar conundrum applied to software development - the code base of systems was growing at an insane speed. Therefore, there was an increasing emphasis on DevOps - using code to manage code.
DevOps combines the concepts of software DEVelopment with IT OPerationS, involving:
-
Code to automate the testing of code (unit testing, integration testing, smoke testing, regression testing, post-verification testing)
-
Code to automate deployment of code (Continuous Integration/Continuous Delivery)
-
Code to build infrastructure to run the code (Infrastructure-as-code)
DataOps, on the other hand combines DATA and IT OperationS, focusing on data-driven methods to manage data and data infrastructure.
Data Hierarchy of Needs
Data is the bloodline of many organisations, whether it powers critical life-saving systems like emergency dispatch systems or is the billion-dollar business of a company (e.g. Google). Think of data like the ‘fuel’ that powers the entire data ecosystem.
Only when you have reliable and timely that has been curated and validated can you build effective ML and analytical models.
Essentially, if you look at the Data Hierarchy of Needs, the focus of DataOps is automating and building the workflow, pipelines and infrastructure that support the entire pyramid to enable faster and reliable data work that sits on top of it.
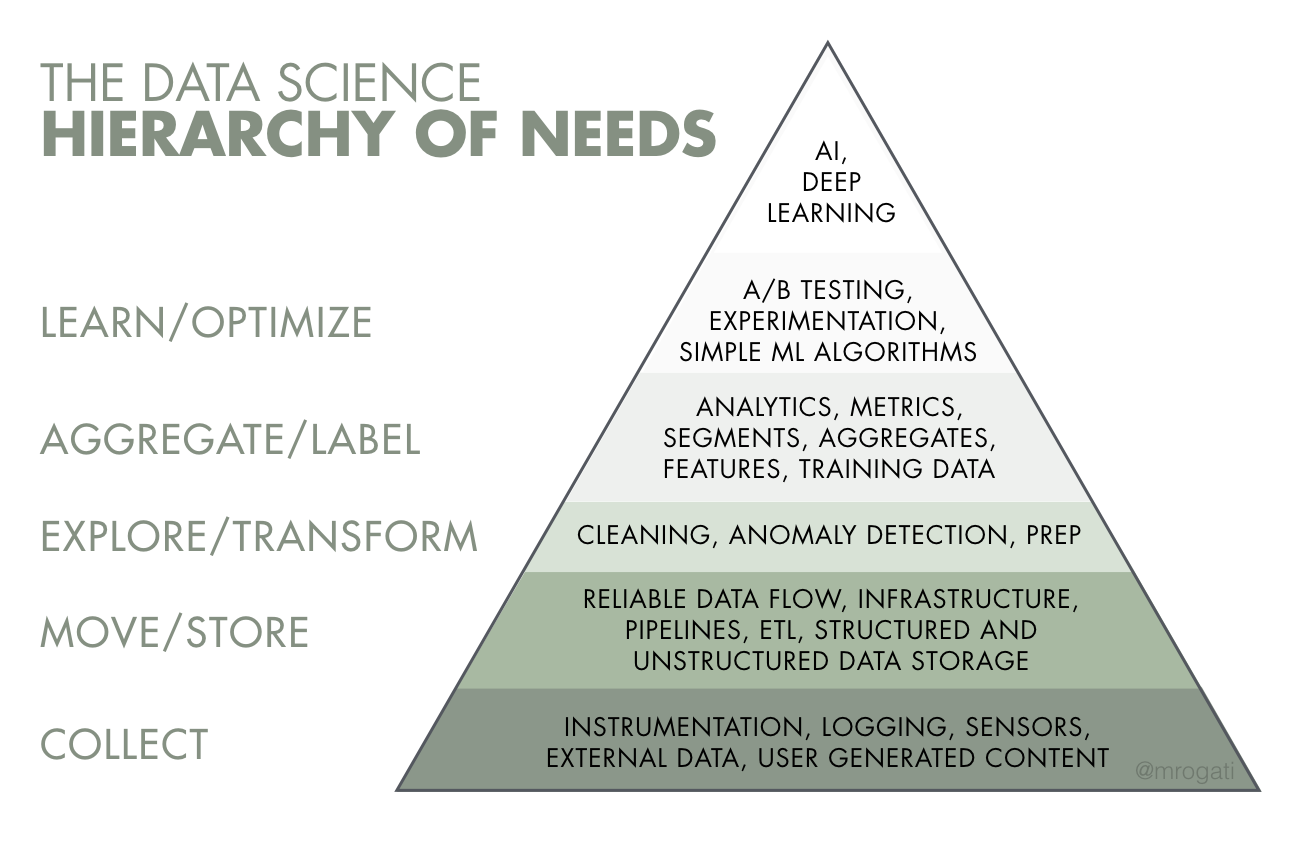 Similiar to humans, there’s also a data hierarchy of needs
Image by Monica Rogati from Hackernoon
Similiar to humans, there’s also a data hierarchy of needs
Image by Monica Rogati from Hackernoon
All data pipelines and workflows, as well as the data infrastructure they attach to, all serve one ultimate purpose - making data into more data that has value-add.
Data
# Do something

More Useful Data

# Do something more

Very Useful Data
Whether it be a data pipeline that turns IoT device reads into the order status for a food delivery app or a data science workflow that turns website clicks into recommendations from a ML-recommender system, all these infrastructure are data-driven. Without the original data, they are effectively useless. If the original data drastically changes, they too become useless.
Therefore, there needs to be a data-driven mindset in dealing with these data.
What this blog post covers
Therefore, the focus of this blog will be on:
-
Data-driven monitoring and testing of data infrastructure
-
Metadata-driven and event-driven data workflows and pipelines
-
Failsafe data workflows and pipelines
- What on earth is DataOps?
- Data-driven monitoring and testing of data infrastructure
- Metadata-Driven and Event-Driven Data Workflows and Pipelines
- Failsafe data workflows and pipelines
- Closing Thoughts
Data-driven monitoring and testing of data infrastructure
It goes without saying, good data quality is essential - good data quality is data that is fit for its intended purpose. To get good data quality, you need good data infrastructure.
For the purposes of this blog, data infrastructure includes:
-
Data Workflow - a series of tasks related to data - e.g. preprocessing -> machine learning training -> predicting
-
Data Pipeline - a series of stages that ingests, transforms and prepare the data for consumption
I won’t cover data lakes or warehouses in detail, as designing a data warehouse has been covered in a prior blog post.
However, like with any other type of software, technical debt both exists in code and data. In software development and code, this relates to design choices that ultimately will cost more to fix/maintain in the future. Similiarly, data technical debt is when data assumptions are made in a point in time that are more costly to fix in the future.
Here’s a few examples to illustrate the point:
-
In data workflows/pipelines, breaks often happen due to changes in the data not the code base. Your code might not change but if the underlying data changes, your pipeline breaks.
-
Historical edge cases in data quality are ignored, but later become very problematic. For example, if only 5% customers in 2012 subscribed to a pay-as-you-go model, so you ignored any errors associated with it. However, in 2019 it is 40% and those ‘edge cases’ are now half of the errors of your pipeline.
-
When data workflows/pipelines are created, it is created for a certain data structure/schema that at point in time. To accommodate this, assumptions are made and get buried deep in the data infrastructure complexity. 5 years later, the new starter is wondering why all the timestamps are cast to UTC.
Data about the data infrastructure
The first step to a data-driven approach dealing with infrastructure is the data itself. Importantly, the data lineage is a key focus, which is information about what happened to the data and where did it move. It’s aim is to provide greater transparency and visibility for root cause analysis in the data context. Benefits include:
- Data Ownership - Identifying who the data owner is
- Data controls - audit trails, restrictions on access
- Data provenance - recording all the inputs, entities, systems and processes that influence the data output
There are two important sources of data need to be treated as first-class data in order for data lineage to be effective:
-
Metadata - data about the data
-
Logs - data on what happened to the data
It is important to appreciate that this data is as valuable as the ‘primary’ data itself. Treat logs and metadata as ‘first-class data’ - i.e. as any other data you would be handling.
The benefit of treating logs and metadata as data means you have access to the wealth of data practices and techniques used in handling and analysing big data.
For example, if you have lacking proper unique identifiers and linkages/key between tables would be considered bad data practices. So if you wouldn’t do that for customer data, you shouldn’t do it for logs and metadata!
This means if you applied the same rigor and data analytics, science and machine learning techniques to the data, you can get very useful insights.
 First class!
Image by Free-Photos from Pixabay
First class!
Image by Free-Photos from Pixabay
Metadata - the window into your data
Metadata is very useful to monitor the ‘state’ and ‘source’ of data. That is:
- What - what is the data about
- When - when was it created/processed
- Which - which systems did it come from
- Why - why does the data exist
- Who - who created the data (or what)
- How - how was the data created
- What else - how it relates to other data
The extension to metadata is automated data quality measurement, which is data calculated from metadata:
-
Accuracy - whether the data accurately captures real world scenarios (e.g. 93% of data is accurate).
-
Consistency/Completeness - whether the data is complete and consistent across a period of time (e.g. in a customer database, every customer has an ID and the total number of customers cannot exceed customer registrations).
-
Integrity- Data validation, which is the structural testing of data to ensure that the data complies with procedures - e.g. the age of a person cannot be over 1000.
-
Timeliness - whether the time the data is expected and the time is available matches (e.g. if your pipeline runs every night to pull stock price data, I should be able to log in tomorrow and see yesterday’s prices. It shouldn’t take 2 days to process one daily runs).
-
Transparency - whether the data lineage/history or source and all the steps that transformed the data are easily traceable (e.g. if I have an ‘order shipped’ field, I need to know all the steps that were taken to derive/calculate that field).
Importantly, you need to capture metadata as part of your data and it should reside alongside your data. After all, data without any background or context isn’t very useful.
Note that regardless of where the data is generated or what the data is, standard metadata rules/definitions need to be created and applied. That way, you have a minimum standard to make sure everyone is ‘speaking the same language’.
Event Logs
Event logs are generated by systems that contain useful information - e.g. number of fails, or how many steps were executed before a failure.
In event-driven pipelines, logs must be respected and properly stored and analysed, as they are the only window into seeing whether the data pipeline is actually working.
In the past, log data was sort of just something you kept for audit purposes - dusted off and taken out of the cupboard when there was troubleshooting/debugging needed. Nowadays log data is useful for software and data professionals to derive useful trends, key insights and even predicting/saving costs.
For example, Facebook created Prophet, an open-source forecasting library that helps them predict demand and resourcing capacity based on their infrastructure logging. As a side note, Facebook collected so much data they even created a new open-source SQL engine, Presto, to handle querying their 300 Petabyte data warehouse, adding in about 4 petabytes of data into their data infrastructure per day.
Treating log events as data creates opportunities to apply data science/analytic techniques, such as:
- Calculating average handling times
- Predicting capacity in the future
- Grouping and categorising errors to identify trends
- comparing events over time
- Seeing user activity and traffic spikes
- Correlation, trends, accuracy of the logs itself
- Whether events happened after another event
For example, discovering real-time correlations between errors and infrastructure resource spikes can help identify what errors are caused by infrastructure bottlenecks, allowing quick fix before the entire data pipeline breaks down.
Monitoring the performance of every aspect of your data infrastructure is crucial. That is, you can get dips and spikes of progress and performance in every stage of say a data pipeline. Where possible, benchmark data-flow cycle times, identify bottlenecks and optimise the data flow.
 Oops wrong type of log
Image by 5598375 from Pixabay
Oops wrong type of log
Image by 5598375 from Pixabay
Automated checkpoints
As mentioned earlier, if you treat logs as data you can derive some really useful insights. In particular, a pipeline is a series of steps and stages and therefore you can have automated checkpoints which measure the following:
- Whether some events ‘dropped off’ - e.g. files that didn’t make it to the next step
- Whether some data produced in the step is poor quality - e.g. missing values, dates that are 1901-01-01
In many manufacturing production lines, a concept called Statistical Process Control (SPC). Essentially it is quality control that uses statistical measures (e.g. % of widgets that failed a step) to monitor the health of the production line. For example, a failure in a step exceeds a threshold, an automated alert is triggered.
This practice is also in accounting and auditing, where an agreed-upon threshold is determined in advance. Any variances that are below this threshold are considered immaterial and therefore not considered to be material.
Why? Data type variances occur in systems - say System A has a different way of storing FLOAT to System B. No matter what rounding, transforming or processing you do, the underlying system will always generate a different decimal point precision. Therefore, rather than trying to get the last 0.000000000000000001 to match, you set a threshold to ignore any variances below this number.
This is where the above mentioned metadata and logs come in - this data is essential for measuring performance and progress at every stage of the data pipeline - how many files got processed, how long did it take, which files are corrupt?
A risk matrix or balanced scorecard approach can be taken with each metric representing the ‘dimensions’ in the matrix, and every single data point getting a rating. For example, every customer account gets a score:
| DQ Metric and Weight | Validity (35%) | Completeness (30%) | Integrity (20%) | Timeliness (10%) | Transparency (5%) | Overall Weighted DQ Score |
|---|---|---|---|---|---|---|
| Example Criteria | 1.0 - Account exists in CRM lookup; 0.5 Account exists in CRM as inactive record | 1.0 - Address filled in with postcode; 0.6 - Address filled without postcode | 1.0 - Address validated via Google Maps API; 0.7 - Address validated but inactive address | 1.0 - Data created within 24 hours of onboarding; 0.8 - Data created within 72 hours of onboarding | 1.0 - Account manager name recorded and person exists in CRM Users; 0.3 - Account manager name recorded but person does not exist in CRM Users | |
| Customer Account A | 1.00 | 0.60 | 1.00 | 1.00 | 1.00 | 0.88 |
| Customer Account B | 1.00 | 0.60 | 1.00 | 0.80 | 0.30 | 0.83 |
| Customer Account C | 0.50 | 0.00 | 0.50 | 0.80 | 0.30 | 0.37 |
This approach is powerful as it lets you calculate aggregated metrics across different data points for the same category (e.g. integrity) or calculate the weighted DQ score for a particular data point.
Furthermore, depending on the grain of your DQ check, you may be able to aggregate the score within a data point (e.g. all the transactions under an account get a DQ score, and the account gets an overall weighted score).
There is a great medium article that explores this concept of DQ weighting and how to apply metrics at the granular-level.
The idea is to eventually write rules-based DQ metrics that can be applied by way of DQ tests. For example, total sum of transactions does not exceed total of account.
For more information about how to write these DQ tests, check out part 3 of this blog series here).
Automated Push-based Alerts
Baseline automated checks allows more confidence in the infrastructure so can address more domain and business-specific problems. The extension to automated data checks is data anomaly detection - when data fails any test, alerts should be raised.
These alerts should be push-based (e.g. email notification) as opposed to pull-based (e.g. having to log into a dashboard) so problems can be detected early and proactively actioned before it starts to significantly impact users or downstream operations.
To determine the ‘sensitivity’ of the anomaly detection, you first select which metric is the most critical (e.g. uptime or data loss) and then determine a fault tolerance level. Whenever that threshold is crossed, a notification is sent (usually via email).
Having context and action points in email alerts is a great way to ensure data issues are addressed become they snowball into larger issues downstream.
Processes for data remediation
Repairing dirty, inaccurate and incomplete data is essential in data work. In fact, under data privacy law (as mentioned in an earlier blog post), it is actually a legal requirement to correct incorrect personal data.
Data remediation usually involves:
- Identifying the incorrect data
- Repairing the incorrect data
- Repairing the process/pipeline that caused the incorrect data
In today’s age where data is generated at an insane rate, like a leak in a pipe, issues can accumulate and quickly snowball into a significant issue. Therefore, it is important to have the infrastructure, monitoring and logging to easily identify the ‘root cause’ (something that will be explored below).
Once the process is fixed, the data pipeline will likely need to be rerun and the ‘blast radius’ of how far the corrupt data propagated needs to be identified so further issues are fixed.
 Found a leak - better fix it!
Image by Steve Buissinne from Pixabay
Found a leak - better fix it!
Image by Steve Buissinne from Pixabay
In some worst case scenarios, data issues may only identified a significant time later, where the downstream systems and models that rely on it may have been using corrupt data for months. In these scenarios, the best that can be done is ‘quarantining’ the bad data. Like contact tracing in real life for infectious diseases, the corrupt data needs to be traced, identified and then fixed/quarantined.
Ensure you have a data pipeline for the logging of the data pipeline
There are two core aspects of good logging data - timely data and informative data. Guess what does that well - a data pipeline!
It is inception - a data pipeline for the logging of another data pipeline. However, as stupid as that might sound, it is important to remember that because log data is a ‘first-class citizen’! You wouldn’t build a poor data pipeline for first-class data would you?
This means the logging should be fault-tolerant and processed ‘exactly once’ (i.e. idempotent) - all things that you would normally do in a event-driven data pipeline. Furthermore, it needs to be real-time ingestion to support real-time monitoring!
Also, like other first-class data, you should store the your log data in a centralised and easily queried. More importantly, it should support ‘live tail’ monitoring, which is being able to query the event logs in real-time. For example, DataDog is a software provider that does quite well.
Make sure your log data is structured like proper data
A good structured log means both humans and machines can easily understand it. Good structure means informative data which translates to dashboards, metrics and graphs that actually make sense.
When you have well-structured logs, end-to-end logging becomes easier, as you have linkages between the events you can dig further into.
Typically log data is ‘unstructured’ in nature (e.g. JSON) - that is, it isn’t in a relational database table format. This allows extensibility, as you can just add extra fields if needed. However, despite this ‘free-form’ structure, there are still a few ‘data warehousing’ concepts I think that should be enforced:
- Every event log should have an event timestamp, timestamp when the logs were ingested in the logging system and event unique identifier
- Events should have natural key unique identifiers, such as customer IDs
- Every single event chain should have a correlation ID
- Every single event log should have a context
Unique Identifiers
Natural key identifiers, such as user ID and customer ID are very useful in event logs. This helps you associate certain events with groups. For privacy reasons, these identifiers can be anonymised, but for log analytic purposes, it is still sufficient (as you can still group events together by a common ID).
Correlation IDs
When you have asynchronous programming and events firing off everywhere, the order/sequence of events and whether events happen at all is very difficult to track. For example, if you ingest a file, you then ingest it, extract the key columns and then convert the date time to UTC. However, what if the date format is wrong and it fails? You want to know which file the data came from, almost like ‘data lineage’ for event logs.
This is where correlation IDs come in - it is essentially an identifier to tracks stages within an event chain. So for the above example, every event would have the same correlation ID, so you know it came from the same original file source.
Without this identifier, it would be impossible to identify which events form part of the same ‘thread’.
Context
The context of an event records the ‘associated’ information surrounding the event, such as:
- operating system
- version
- event source
This allows replay easier if you know which version was run, the source of the event triggers etc.
Metadata-Driven and Event-Driven Data Workflows and Pipelines
Your data infrastruture should not only be monitored by data, but also driven by data!
 Pipelines
Image by Robson Machado from Pixabay
Pipelines
Image by Robson Machado from Pixabay
What does metadata-driven mean?
Within DataOps, data workflows/pipelines are the backbone of the infrastructure - many mission critical downstream systems, applications, models are built on the data it produces. As cloud technology and more and more devices are generating data, being able to stand up quick and reliable data pipelines is no longer a luxury - it is a key business requirement.
To facilitate this, having data pipelines that are driven by metadata will minimize duplicate code and be scalable, extensible and flexible to adapt to changes. It is ‘metadata-driven’ in the sense that the source, data structure, target, schedules, frequency are all defined by metadata. With this parameterisation, you can add more data sources and data runs simply just by appending to the metadata database.
For example, rather than having a data pipeline that is built to move data from database A to database B based on Schema X, you have a data pipeline that moves data X from A to B. A and B can be swapped out by a database or even an IoT device. The pipeline is built with a view of expanding it to future data sources and data types.
For example you could have metadata tables that define:
-
Data sources - where the data objects are from. This can be persistently stored so legacy data still has data lineage that shows where it came from (even if the source system no longer exists anymore).
-
Data objects - every object is associated with a data source
-
Dependency group - every object is associated with a dependency group - this determines the execution order of the ingestion
-
Metadata attributes - every attribute is associated with a data object
-
Job Run - like the log table, you would have a batch ID, with multiple process IDs associated with (for example one for each object ingestion)
An example of data source metadata:
| Data Source ID | Source Type | Name | Parameters | Credentials |
|---|---|---|---|---|
| 1 | MySQL | MyAwesomeSQL | {Port: 3306, Database: myDataBase} | {username: svc_myabc, password: svc_myabc} |
| 2 | REST API | myawesomeapi.com | {protocol: HTTPS, type: 'GET'} | {api_key: api_key} |
| 3 | S3 | MyAwesomeBucket | {prefix: /Data/} | {aws_access_key: 123, aws_secret_key: 123} |
An example of data object metadata:
| Object ID | Source ID | Dependency Group | Name | Type | Load Pattern | Filter Expression |
|---|---|---|---|---|---|---|
| 1 | 1 | 1 | myAwesomeTable | Table | Full | WHERE CustomerID IS NOT NULL |
| 2 | 1 | 1 | MyAwesomeView | View | Delta | |
| 3 | 2 | 2 | WeatherData | API-JSON | Full |
Metadata attributes are can either schema-on-read or derived from the information schema of the source database. For example, make it execute:
SELECT * FROM information_schema WHERE tableName = {mytableName}
Furthermore you would have a job run and log table that records the watermarks for delta runs, as well as amount of data extracted and ingested.
A watermark describes a point of reference delta loads - that is, it only loads data ‘above’ the watermark, with the aim to only capture/ingest the changes (i.e. ‘deltas’) to the source system.
An example of job run metadata:
| Process ID | Batch ID | Object ID | Dependency Group | Rows Extracted | Rows Inserted | Rows Updated | Start Time | End Time | Status | Delta Watermark |
|---|---|---|---|---|---|---|---|---|---|---|
| 1 | 1 | 1 | 1 | 5,000 | 5,000 | 0 | 2019-07-01 12:00 | 2019-07-01 16:00 | SUCCESS | CustomerID 10000 | 15000 |
| 2 | 1 | 2 | 1 | 1,000,000 | 500,000 | 500,000 | 2019-08-15 02:00 | 2019-08-15 02:30 | SUCCESS | |
| 3 | 1 | 3 | 2 | 2019-08-16 07:00 | 2019-08-17 08:00 | FAILED |
If you want to ensure that deprecated sources and systems are captured, you could make all the above metadata tables Type 2 Slowly Changing Dimension.
That is, for example, the below shows what happened when the customer data was migrated into a new CRM (with a different data source ID):
| Object ID | Source ID | Name | Type | Filter Expression | VALID_FROM | VALID_TO | CURRENT_INDICATOR |
|---|---|---|---|---|---|---|---|
| 1 | 1 | myAwesomeTable | Table | WHERE CustomerID IS NOT NULL | 2019-01-01 | 2020-05-01 | N |
| 2 | 2 | MyAwesomeTable | Table | WHERE CUSTOMER_ID = '' | 2020-05-02 | 9999-12-31 | Y |
| 3 | 2 | WeatherData | API-JSON | 2018-09-16 | 9999-12-31 | Y |
What does event-driven mean?
In today’s data world, there are many forms of unstructured and event-driven data, such as clicks on a website, IoT devices transmitting data (e.g. temperature and sensor monitoring), self-driving vehicle sensors etc.
Traditional monolithic ETL pipelines were scheduled and often have a few drawbacks:
- Data was only up to date after a run
- Error handling was more difficult - if one part of the pipeline failed, the whole pipeline would generally fail. Individually retrying certain parts was difficult
- Pipelines were not scalable, as the coupling between the source and target system was heavy.
For example, many traditional ETL pipelines often were run overnight, pulling data from source systems at say 10pm to transform and load into the central data warehouse.
To see how event-driven architecture works and why it’s more resilient, here is link to my prior blog post.
Failsafe data workflows and pipelines
In the age of multi-cloud and multi-devices, there is so much communication happening between systems that failures are basically a given. It’s a question of when, not if. Having systems talk to each other is a big task and things WILL FAIL.
Planning for failure
As Benjamin Franklin’s stated, ‘if you fail to plan, you are planning to fail’. Accepting that failures will occur and building resiliency around it is more important than trying to aim for a 100% system.
 So I know one of these events failed…I think?
Image by PublicDomainPictures from Pixabay
So I know one of these events failed…I think?
Image by PublicDomainPictures from Pixabay
Importantly, build your pipelines to accept that failure is a legitimate outcome of a process. For example, if the source data is bad, the process should fail. The question is then how do you handle it - do you retry, do you move it to a dead letter queue, do you throw an alert?
If you think of it from a risk-assessment perspective, there are many risks in real life that you cannot 100% mitigate. For example, you wear seatbelts because there’s always a possibility of a car crash whenever you drive. You cannot 100% mitigate this risk (unless you don’t drive at all), so you take steps to mitigate the damage when it occurs.
Similiarly, using this risk perspective, data pipeline resiliency needs to address:
- Detection - how do you know when something’s gone wrong?
- Prevention - how do you prevent errors?
- Correction - how do you actual handle bad data and errors?
It is better to fail fast, fail safe, fail visibly. In software development, ‘fail fast’ is a concept where if something goes wrong, it should fail as soon as possible so error handling can happen. When it does fail, it should fail in a way that doesn’t cause a corrupted state and should not fail silently.
 Risk is uncertainty, like in gambling
Image by 5598375 from Pixabay
Risk is uncertainty, like in gambling
Image by 5598375 from Pixabay
Indempotency
The key to fault-tolerance and failsafe data workflows and pipeline is indempotency. If component/step of the data workflow and pipeline is indempotent, it means the same function can process the data as many times and result in the same outcome.
This is important because:
- Duplicate data is never loaded or created - even if reprocess the same file twice
- Data is never lost if a step fails
- No corrupt data is loaded downstream if a step fails
For example, AWS Lambda is a serverless function-as-a-service where you can architect a data pipeline that has one function per file. In some rare instances, more than one function may be accidentally spun up for the same file. Even in Lambda, sometimes data is accidentally reprocessed twice (even concurrently).
Some tips to create indempotent processing:
-
If a duplicate event is detected, the function should fail gracefully and not throw errors (which may cause further retries or error handling)
-
Process data in isolated and independent batches - if a batch fails, it shouldn’t affect the rest of the pipeline. For example, batches of 100 or grouped by timestamp (today, tomorrow, day after)
-
Implement rollbacks with error handling - if the processing fails, all the created data should be reversed/deleted (e.g. delete created files in S3)
-
Data that fails a particular automated data checkpoint should be ‘quarantined’ and not further processed down the line to prevent downstream data corruption
-
De-duplicate and clean staging data before processing - it is important to truncate staging data before a re-run to avoid duplications. If you are using persistent staging, ensure that you de-duplicate (by selecting only the latest run data) before processing
SQL-specific Tips for Indempotency
If the target data source is a SQL database, use atomic transactions - transaction blocks are a great way of ensuring only successfully processed transactions are committed into the database.
For example, the boilerplate method to deal with this in MS SQL Server is:
BEGIN TRANSACTION; --Make an explicit transaction
BEGIN TRY
--Do DDL T-SQL statements here - e.g. INSERT, UPDATE, DELETE
END TRY
BEGIN CATCH
  IF @@TRANCOUNT > 0 --If any uncommitted trans exist
      ROLLBACK TRANSACTION;
  END CATCH;
IF @@TRANCOUNT > 0
  COMMIT TRANSACTION;
GO
Furthermore, use SQL MERGE statements where possible - these statements can do INSERTS, UPDATES and DELETEs all at once, where:
- It only inserts data if it doesn’t exist in the source
- It updates old target data if the source data is newer
- It deletes old target data if it doesn’t exist in the source data
For example:
MERGE dbo.targetTable AS tgt
USING (
  SELECT
    CustomerID
    ,CustomerAge
    ,CustomerAddress
    ,LastModified
  FROM dbo.srcStagingTable AS src
ON src.CustomerID = tgt.CustomerID
WHEN MATCHED AND src.LastModified > tgt.LastModified THEN
--If the customer already exists, update the existing record
  UPDATE SET
    tgt.CustomerAge = src.CustomerAge
    tgt.CustomerAddress = src.CustomerAddress
    tgt.LastModified = src.LastModified
WHEN NOT MATCHED THEN
--If the record doesn't exist, insert it
  INSERT (
    CustomerID
    ,CustomerAge
    ,CustomerAddress
    ,LastModified
  )
  VALUES (
    src.CustomerID
    ,src.CustomerAge
    ,src.CustomerAddress
    ,src.LastModified
  )
WHEN NOT MATCHED BY SOURCE THEN
--If the record doesn't exist in the source, delete it
  DELETE
Chaos Engineering
As mentioned before, if you accept failures will occur, you need to test what happens if multiple failures happen.
Chaos Engineering, developed by Netflix, basically is when someone (the chaos monkey), comes in and starts randomly screwing around with the system. They start turning things off, corrupting some data to see how the system reacts and handles cascading failures.
Some examples include:
- Stimulating the failure of an entire data centre or cloud region
- Start turning off some queues and error handlers
- Deliberately injecting latency or maxing out resources with high traffic
- Deliberately passing in lots of bad data
- Deliberately causing functions to throw errors
- Forcing the system to be out of sync (i.e. time travel and out of sync data)
- Executing things out of order in the pipeline
 A monkey or a cat will do
Image by g3gg0 from Pixabay
A monkey or a cat will do
Image by g3gg0 from Pixabay
Data Versioning
There are some concepts in event-driven architectures that should be adhered:
- Events are immutable - they happened in the past, so you can’t change them
- Events are replayable - you should be able to get to the exact same state of data if you reprocess all the past events in the right order
This is analogous transaction logs in Relational Database Management Systems (RDBMS). Rather than constantly snapshotting and keeping duplicate copies of data, a database keeps a data snapshot at a point of time and all the transactions that were applied onto the data. That way, if the database is corrupted, all you need is to get the snapshot data and reprocess all the transactions and the data will return to the current state.
However, in the advent of cloud technology, storage has become cheaper so to reduce the risk of data corruption, data versioning is done. What this means is every stage of a data workflow or pipeline doesn’t modify the data, but rather produces a new version of the data (often using Kimball Type 2 Slowly Changing Dimension). That way, if corruption occurs, you can replay the event on the original data source.
If you version control source code, why shouldn’t you do the same for data?
Separate all the business logic into a consumption zone
A good pattern to implementing ‘version control’ is adopting the Stage - Transform - Consume pattern.
For data pipelines, it has distinct stages that each serve a purpose:
- Ingest/Stage - getting the data into the data lake. No processing is done and the ‘raw’ data is just dumped in.
- Transform - cleaning, staging, transforming the data so it is consumable by other downstream systems
- Consume - applying business logic and BI/data warehousing techniques that reflect the use case and business operations of the users
A great open-source tool that helps orchestrate these stages is Apache Airflow. Airflow was created by Airbnb and made open-source which:
- creates data pipelines as infrastructure-as-code, so they are easily reproducible
- executes, schedules and orchestrates the stages of your data pipeline (including event triggers based on data changes or waiting for two tasks to finish before moving on)

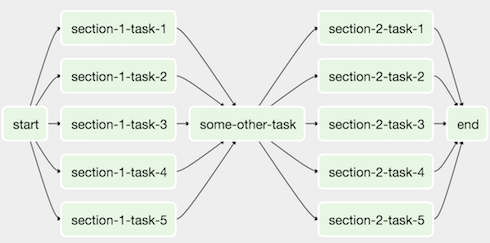
The entire pipeline is represented by directed acyclic graphs (DAG), which are basically one-way flow of series of tasks. Each task can have dependencies, so tasks with dependencies are only executed after the first tasks are run.
An example of an Airflow DAG looks like this:
Clearly delineating the business logic into the consume stage means that there’s only one location to that has the business logic.
It is tempting to include business logic in the processing stages of a data workflow or pipeline. For example:
- excluding customers that don’t have contracts in the transform stage
- applying a business rule of filling in nulls with default customer contract
The biggest benefit is if you swap out data sources or update the transformation layer, the consumers are not affected. Inversely, if you need to update the business logic, you don’t need to dig through the whole pipeline to find it.
There’s an emerging term that refers to constructing the consumption layer and data warehouse called ‘analytics engineering’ This workflow is dedicated to only applying business logic and is a field of its own - given how complex it can potentially be to make data that is fit for BI/data analytics.
A popular workflow tool that converts SQL to infrastructure-as-code to engineer the consumption layer is DBT.
Closing Thoughts
So that was a flavour of what DataOps is and some things to look out for in data infrastructure.
I believe it is important to discuss DataOps practices, as it’s not something that’s considered as ‘sexy’ as data science, ML or AI. But like many things in life, the best type of infrastructure is the type you never notice. For example, most people won’t notice water pipes and all the complex infrastructure needed to carry water around.
 Infrastructure
Image by Free-Photos from Pixabay
Infrastructure
Image by Free-Photos from Pixabay
If data infrastructure is done right, you shouldn’t need to worry about whether a data pipeline will fail and give bad data tomorrow. Because, if it does, you have all the tools and processes you need to catch it early and fix it!
See part 2 here on using data to find information about data!