Experimenting with Facebook’s Prophet library!
Facebook’s Data Science teams, as well as operational teams, are often faced with coming with forecasts for infrastructure peaks/troughs etc. For example, if 1 million users suddenly needed to look at cat memes. This means good infrastructure planning is needed!
To make life easier and come up with quick forecasts, Facebook developed Prophet - it is designed to operate on daily basis and factors in holiday effects, seasonality etc. The library allows powerful forecasting without a significant amount of statistical tweaking, such as required in more heavy methods, such as ARIMA models.
It’s basically forecasting out of the box for time-series data- and its free!
![]() Facebook Prophet - Open-source forecasting at scale!
Facebook Prophet - Open-source forecasting at scale!
Fulfilling out Prophecy using Prophet
Using Facebook’s open-sourced forecasting library, we are able to do lightweight forecasting to get powerful results!
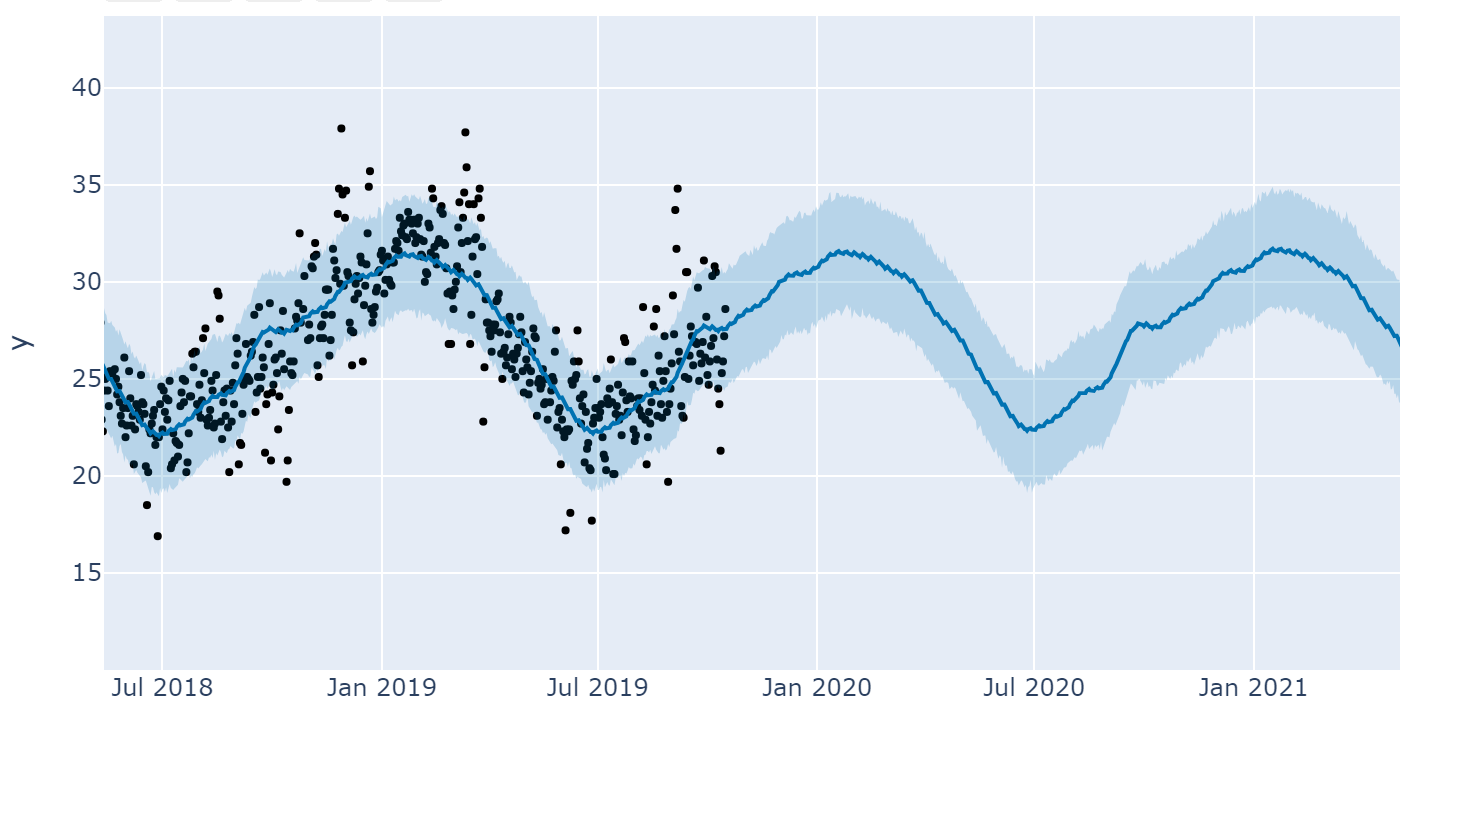
 The black dots are the actual weather observations, with the blue line representing the forecasting model. Pretty accurate for an out-of-the-box model!
So what did we find?
Prophet comes with a lot of out of the box libraries that let you see your time-series data. In this case, I picked Brisbane weather data and played around with the temperature dataset from 1999 to 2019.
 You can see Brisbane weather is seasonal (excuse the pun) - that is, every winter it’s colder, every summer is hotter…
The forecasting model I created eventually came up with this prediction, with the blue shaded around indicating the confidence interval and black dots indicating actual temperature reads:
Finding the unexpected!
In the Exploratory Data Analysis of the Brisbane weather forecasts, I also picked up a few interesting tidbits!
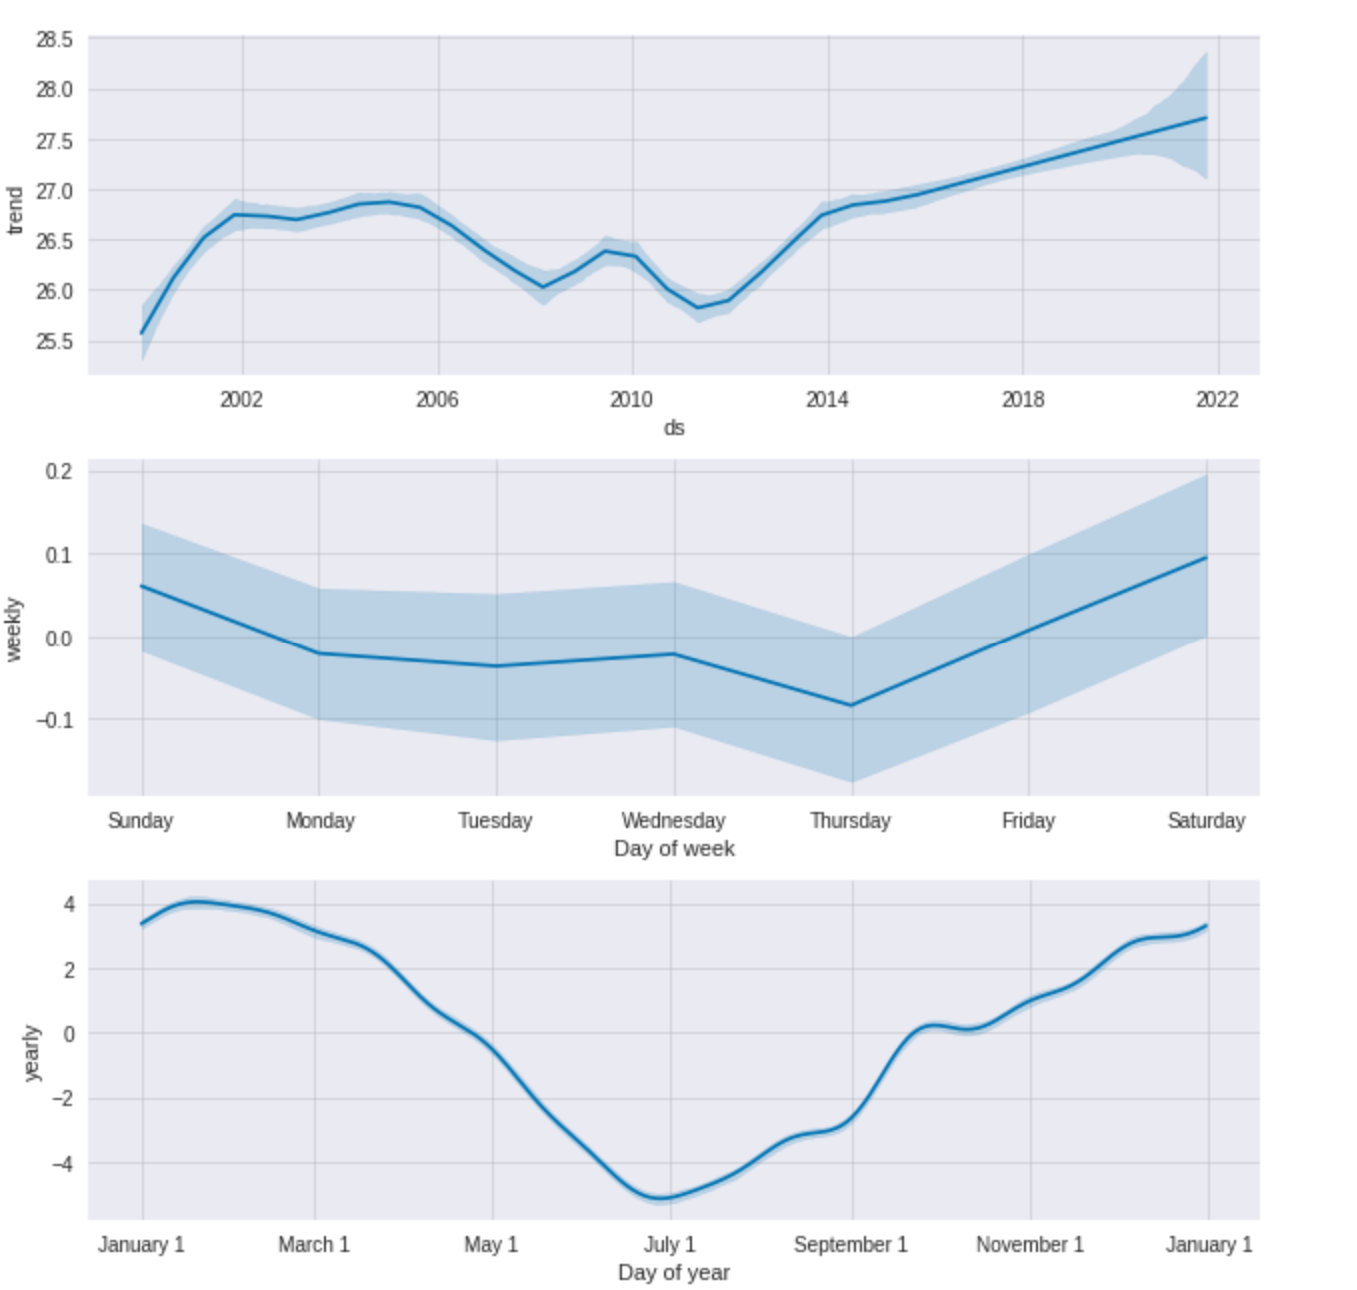
What do the graphs show? Well interesting:
-
Global Warming! Brisbane is getting hotter, with the average temperature gradually going up over time!
-
Cold Thursdays! Thursday seems to be on average the coldest day of the week!, while Saturday seems to be on average the hottest
-
Chilly Julys! Being Southern hemisphere peeps, Brisbane’s July is the coldest month and February being the hottest!
See the details in my Kaggle notebook!
In my Kaggle Notebook, I walk through how I did the preprocessing, EDA and training and cross-validation of the weather datasets!