Why look at traffic
The COVID-19 pandemic impacted many aspects of our lives - in particular, how mobile we are.
What sparked me to look at this data was I wanted to know how new variants impact the behaviour of human traffic. In particular, whether people naturally will avoid going out despite no government-mandated lockdowns.
This analysis aims to look at two main parts:
- How did introduction of variants affect human traffic
- How did lockdowns affect human effect
The focus will be on 6 main cities:
- Brisbane (greater metro area)
- Sydney (greater metro area)
- Melbourne (greater metro area)
- Singapore
- Tokyo (greater metro area)
- New York (5 boroughs)
If you want more details on how I did the analysis, including the relevant Python code base, please check out the interactive Kaggle notebook.
Background on the Datasets
Google collects location data, aggregated and anonymised, for the purposes of research. The “Google COVID-19 Community Mobility Reports”. is intended to assist organisations in making decisions relating to the COVID-19 pandemic.
These datasets show how visits and length of stay at different places change compared to a baseline.
Changes for each day are compared to a baseline value for that day of the week. The baseline is the median value, for the corresponding day of the week, during the 5-week period Jan 3–Feb 6, 2020.
For the purposes of this analysis, the dataset date range was 15th February 2020 to 21 January 2022. The changes are expressed in percentages (%).
Brisbane
Focusing just on just selected categories, the results are this:
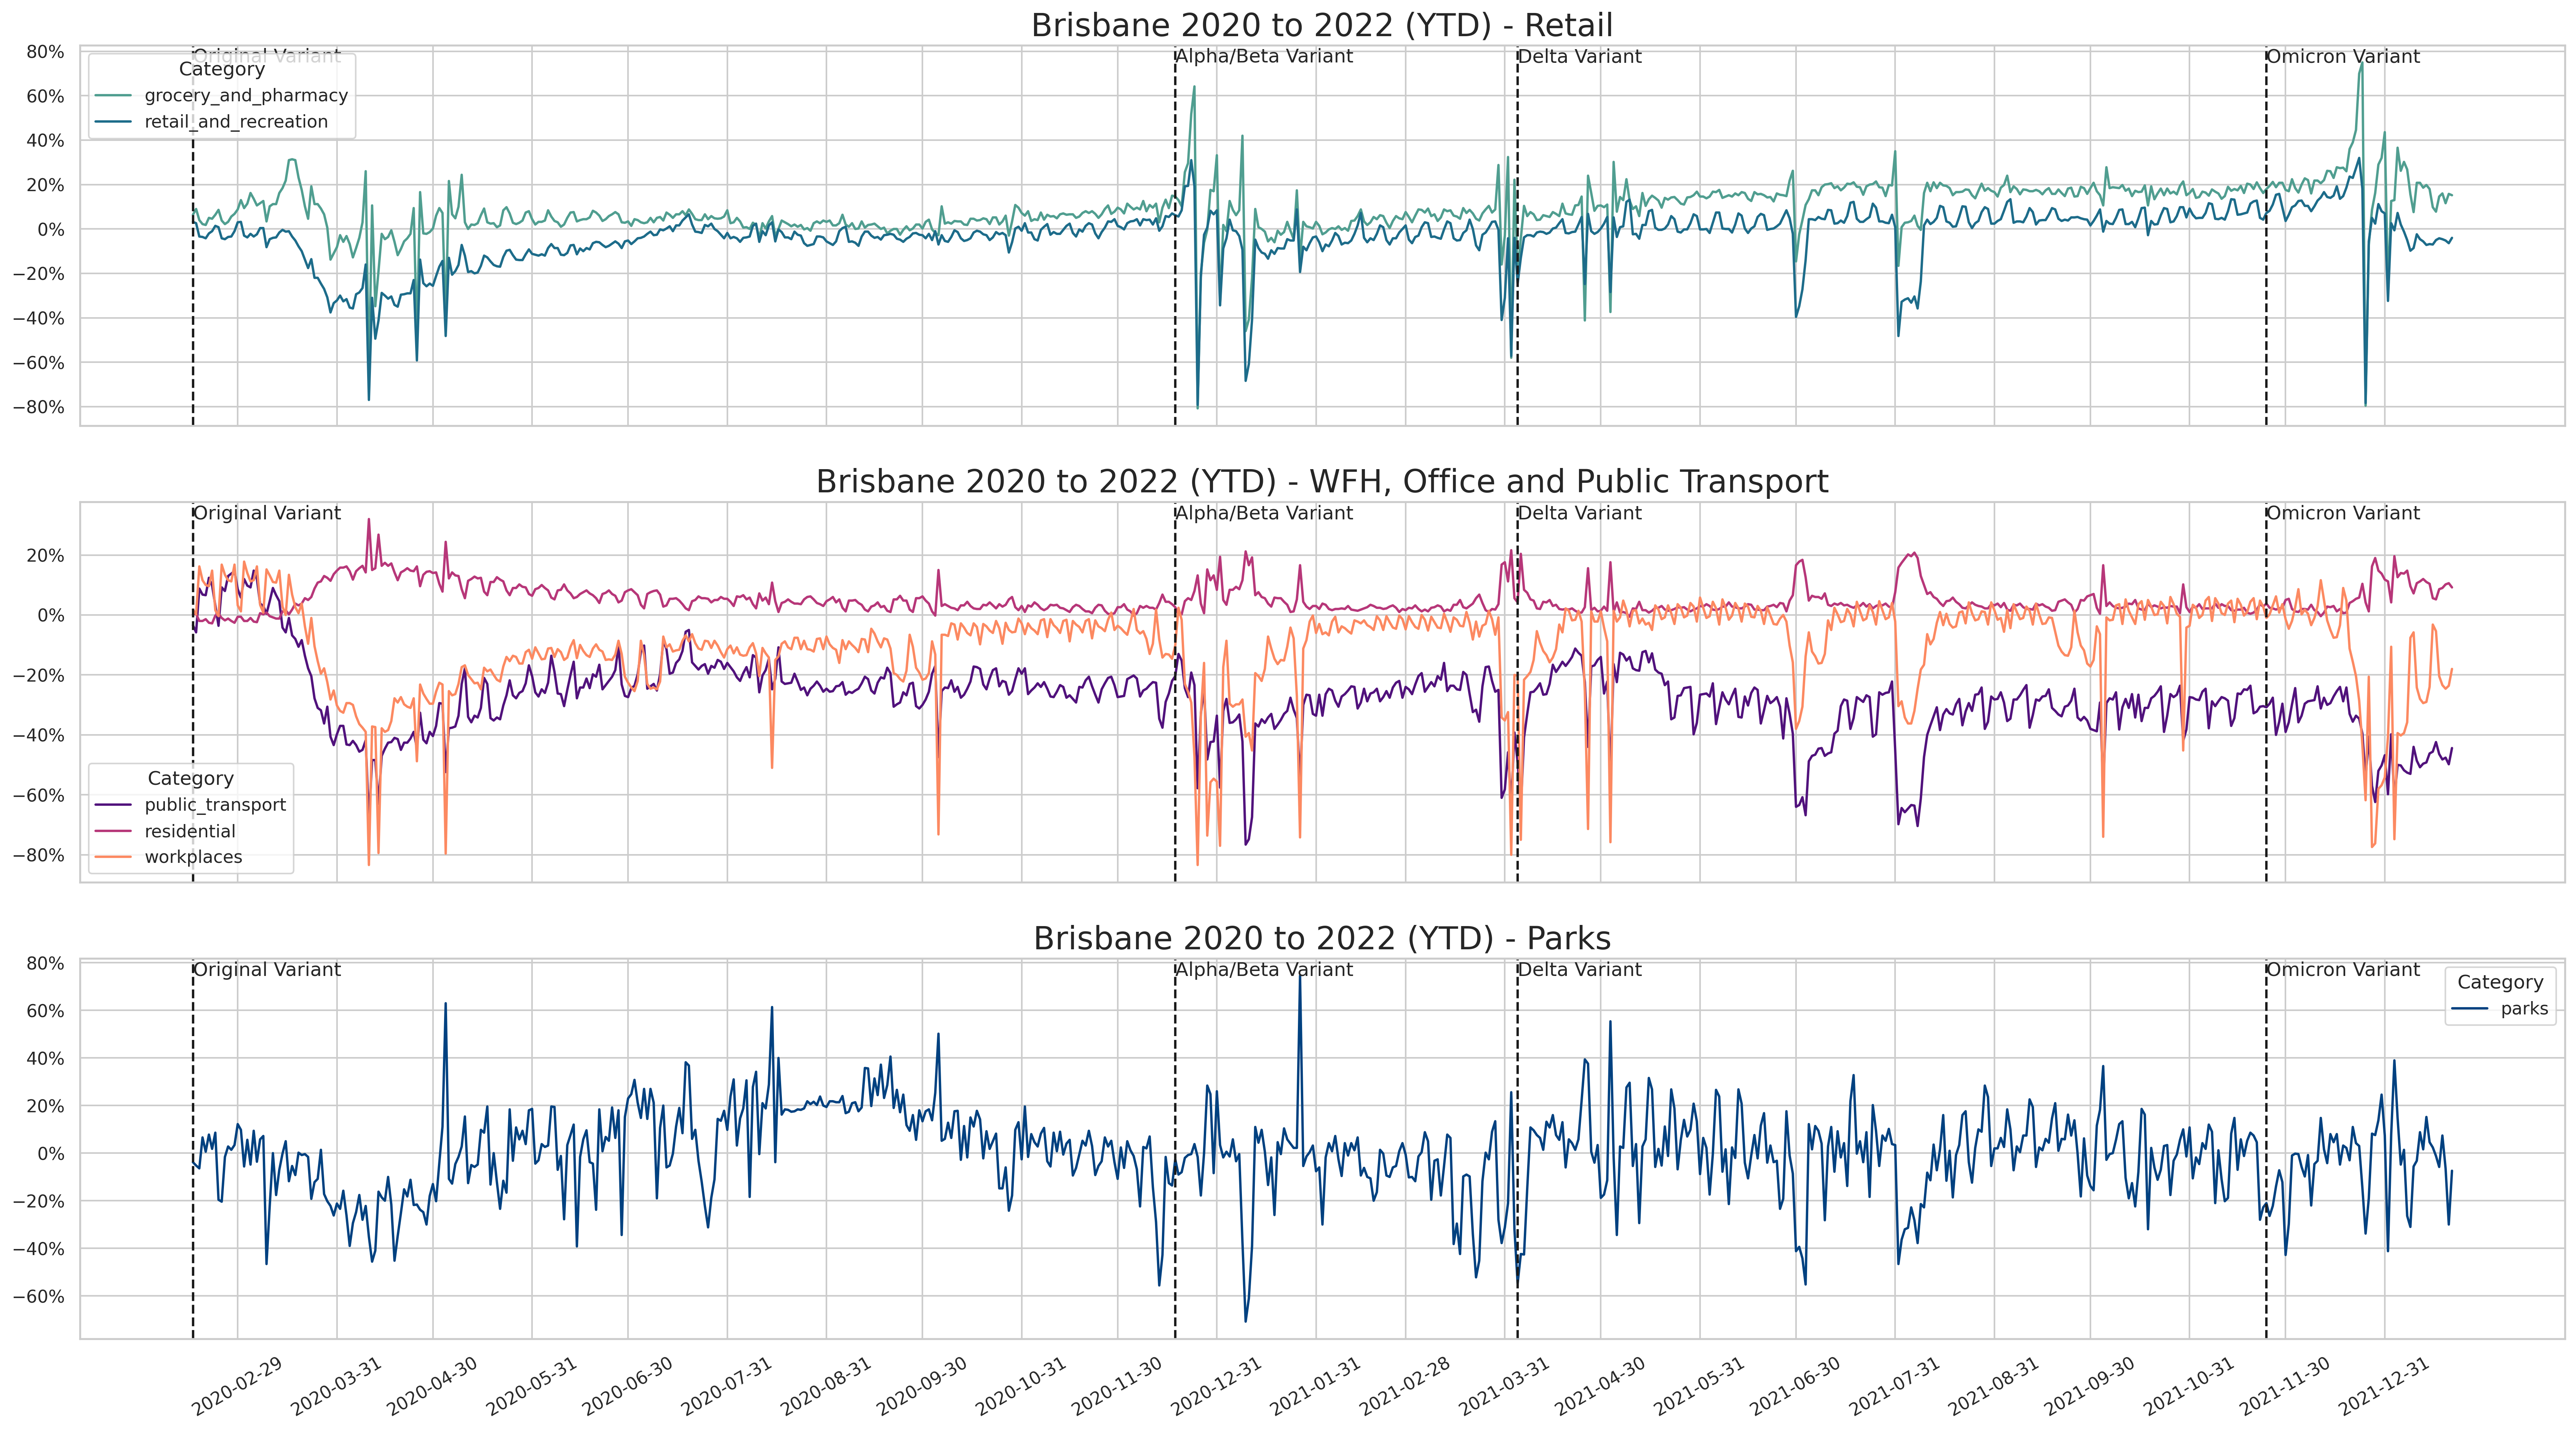 Brisbane Mobility during Pandemic
Image from my Kaggle notebook .
Brisbane Mobility during Pandemic
Image from my Kaggle notebook .
Immediately there are few observations:
-
Australia’s 1st lockdown occurred roughly between March and June 2020. You can see how it affected workplace traffic.
-
Between April and July 2021, a series of snap lockdowns occurred. You can see the effects of the lockdown with a spike reduction in retail and workplace traffic.
-
You can see the initial hit from the variants hit retail particularly hard.
-
You can also see that workplace traffic has still not returned to pre-COVID levels.
-
While no lockdown has occurred in Brisbane since Omicron was discovered, there has been a de facto lockdown, with traffic dropping to lockdown levels. In fact, it’s the high drop in retail activity even compared to previous lockdowns.
-
Human traffic in parks significantly went up on average, as well as staying at home.
-
Workplaces also show a significant drop in traffic right after a new variant, but gradually come back.
-
Even during non-lockdowns when workplace traffic almost returned to normal, public transport patronage was still almost half of pre-pandemic levels. This implies that people are going to work via private vehicles more now since the pandemic.
If you dive deeper to see the relationship with public transport vs workplaces, you will find:
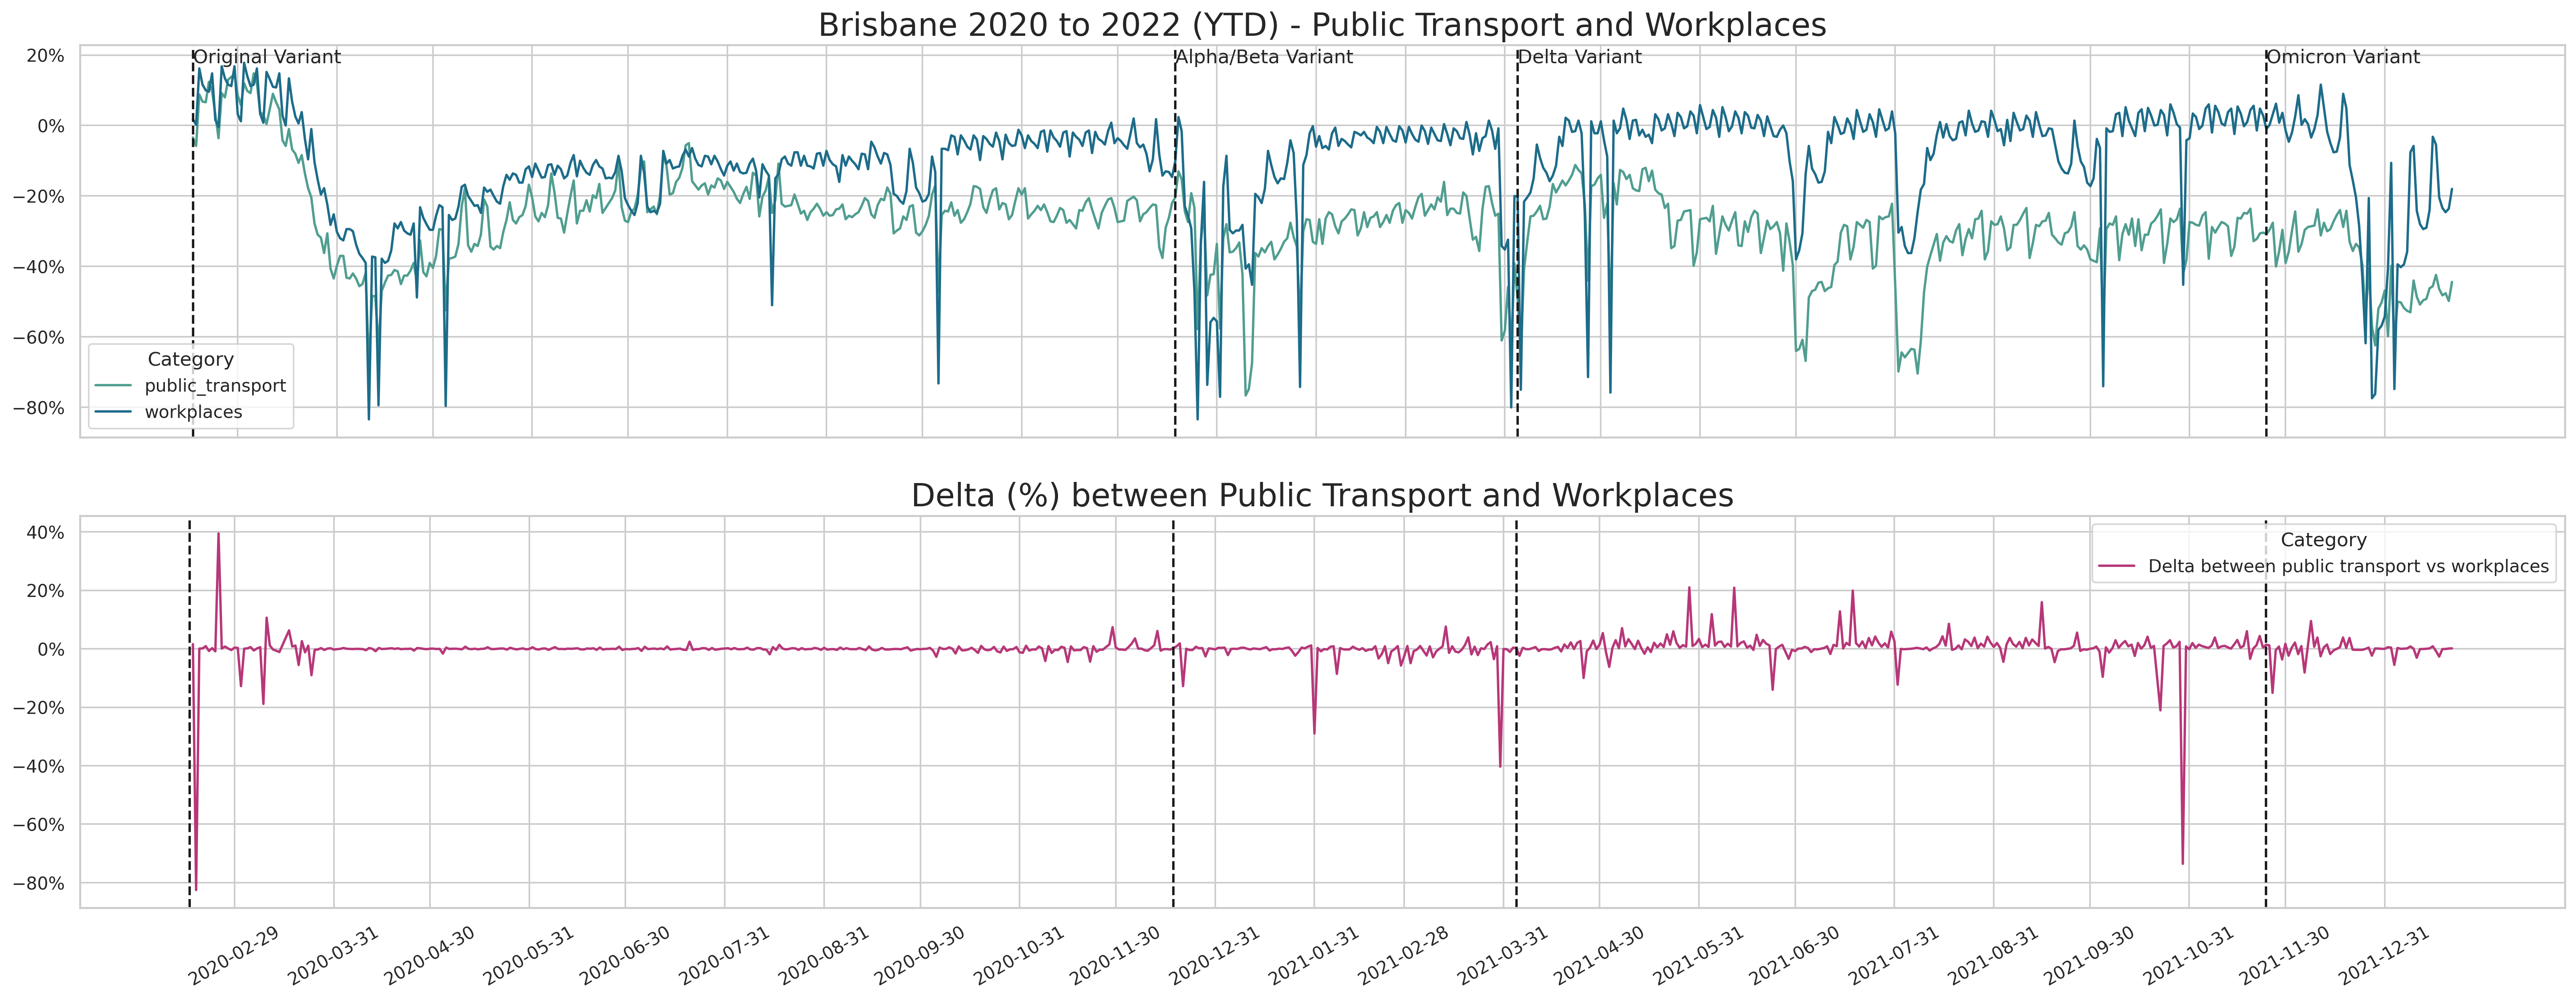 Brisbane Public Transport and Workplace traffic
Image from my Kaggle notebook
Brisbane Public Transport and Workplace traffic
Image from my Kaggle notebook
You can see that the majority of the time the delta is centred around zero, indicating that the correlation is quite high. Calculating the correlation: it is 64.48%! So as expected, this means a large chunk of public transport patrons are heading to work or coming from work!
Sydney and Melbourne
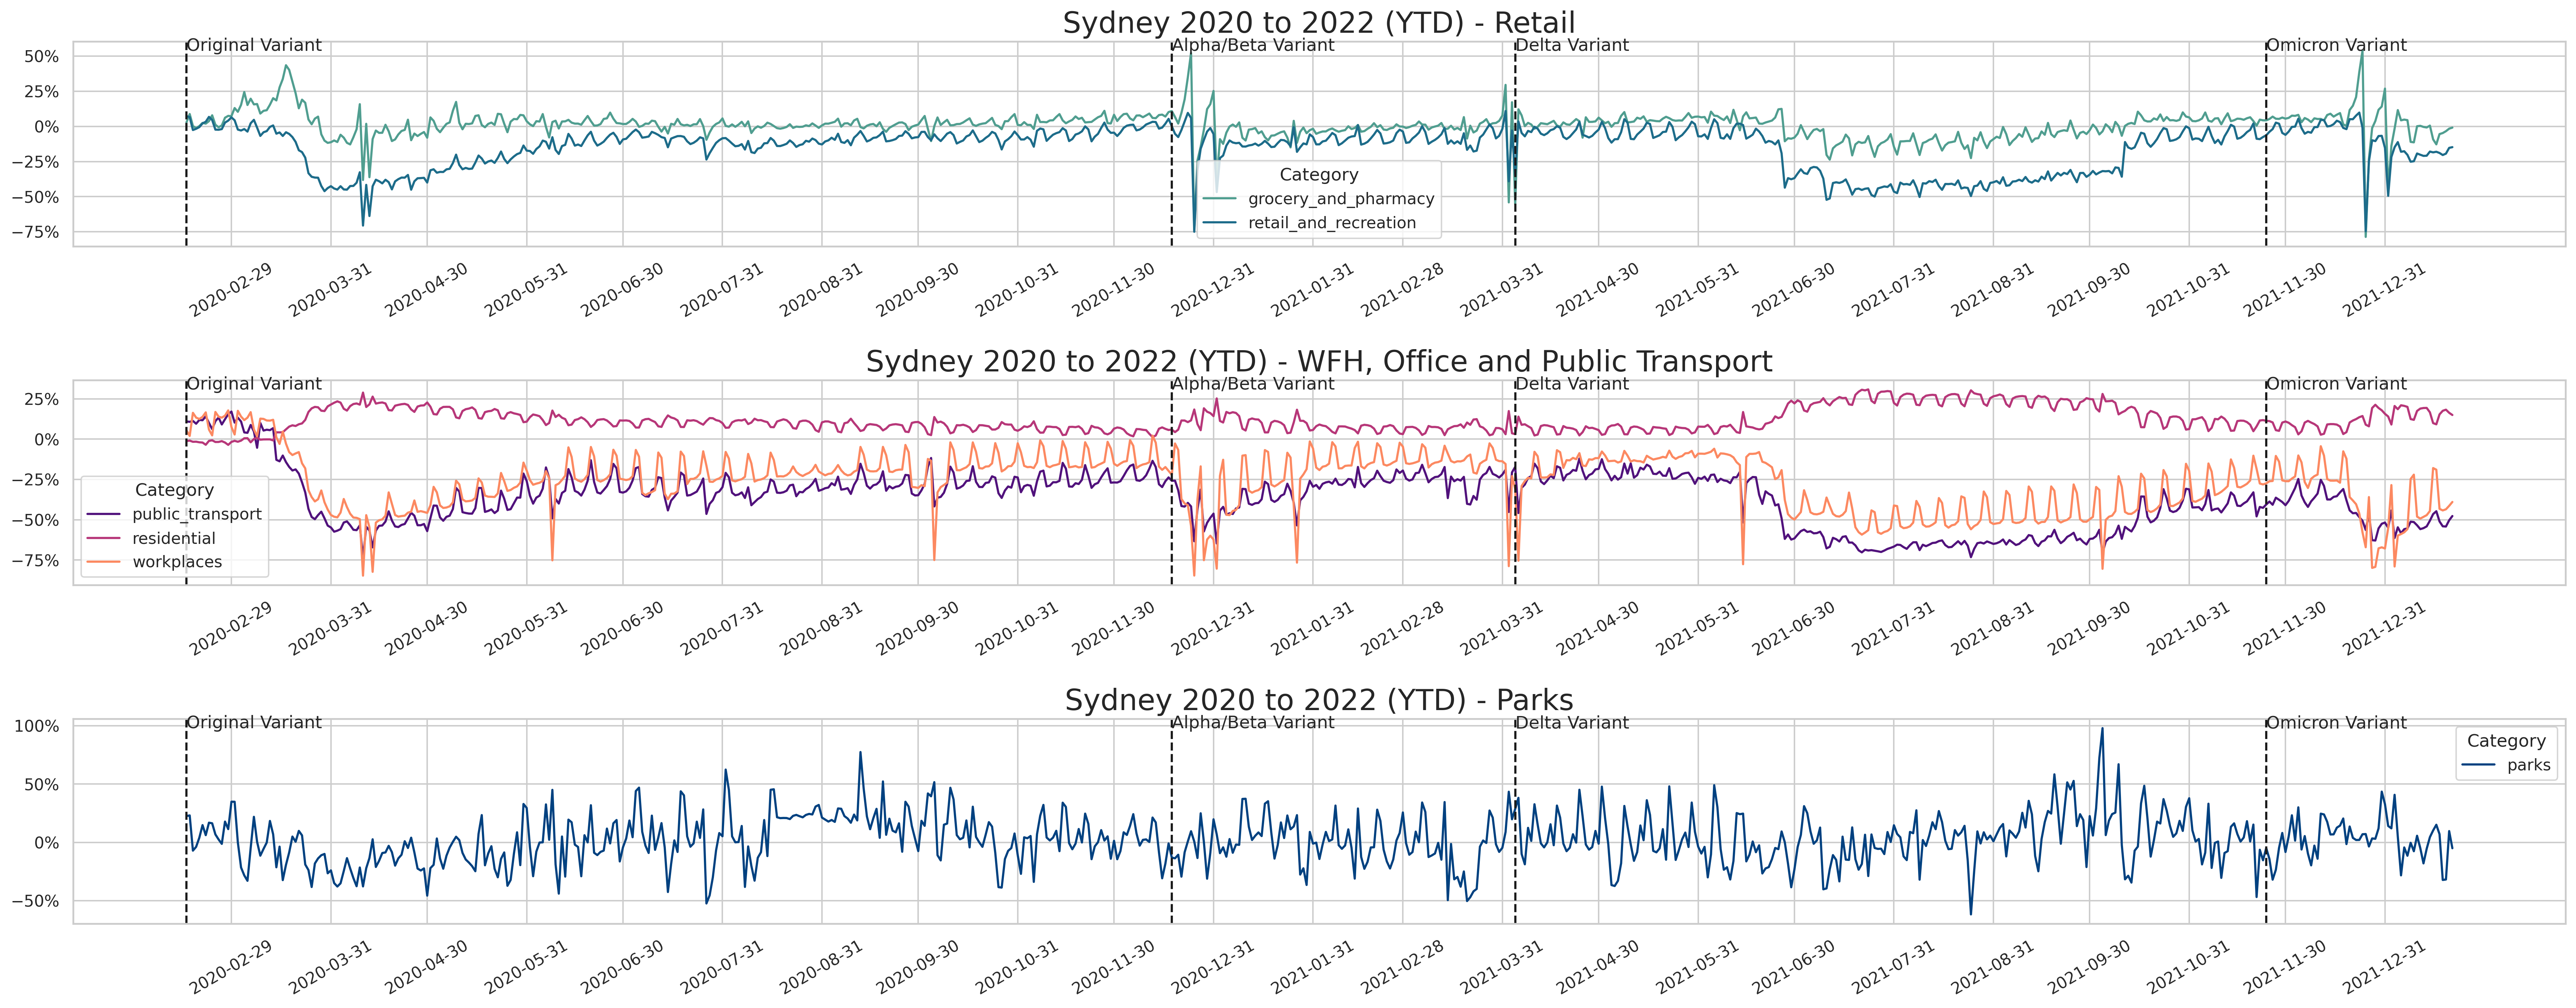 Sydney Mobility during Pandemic
Image from my Kaggle notebook
Sydney Mobility during Pandemic
Image from my Kaggle notebook
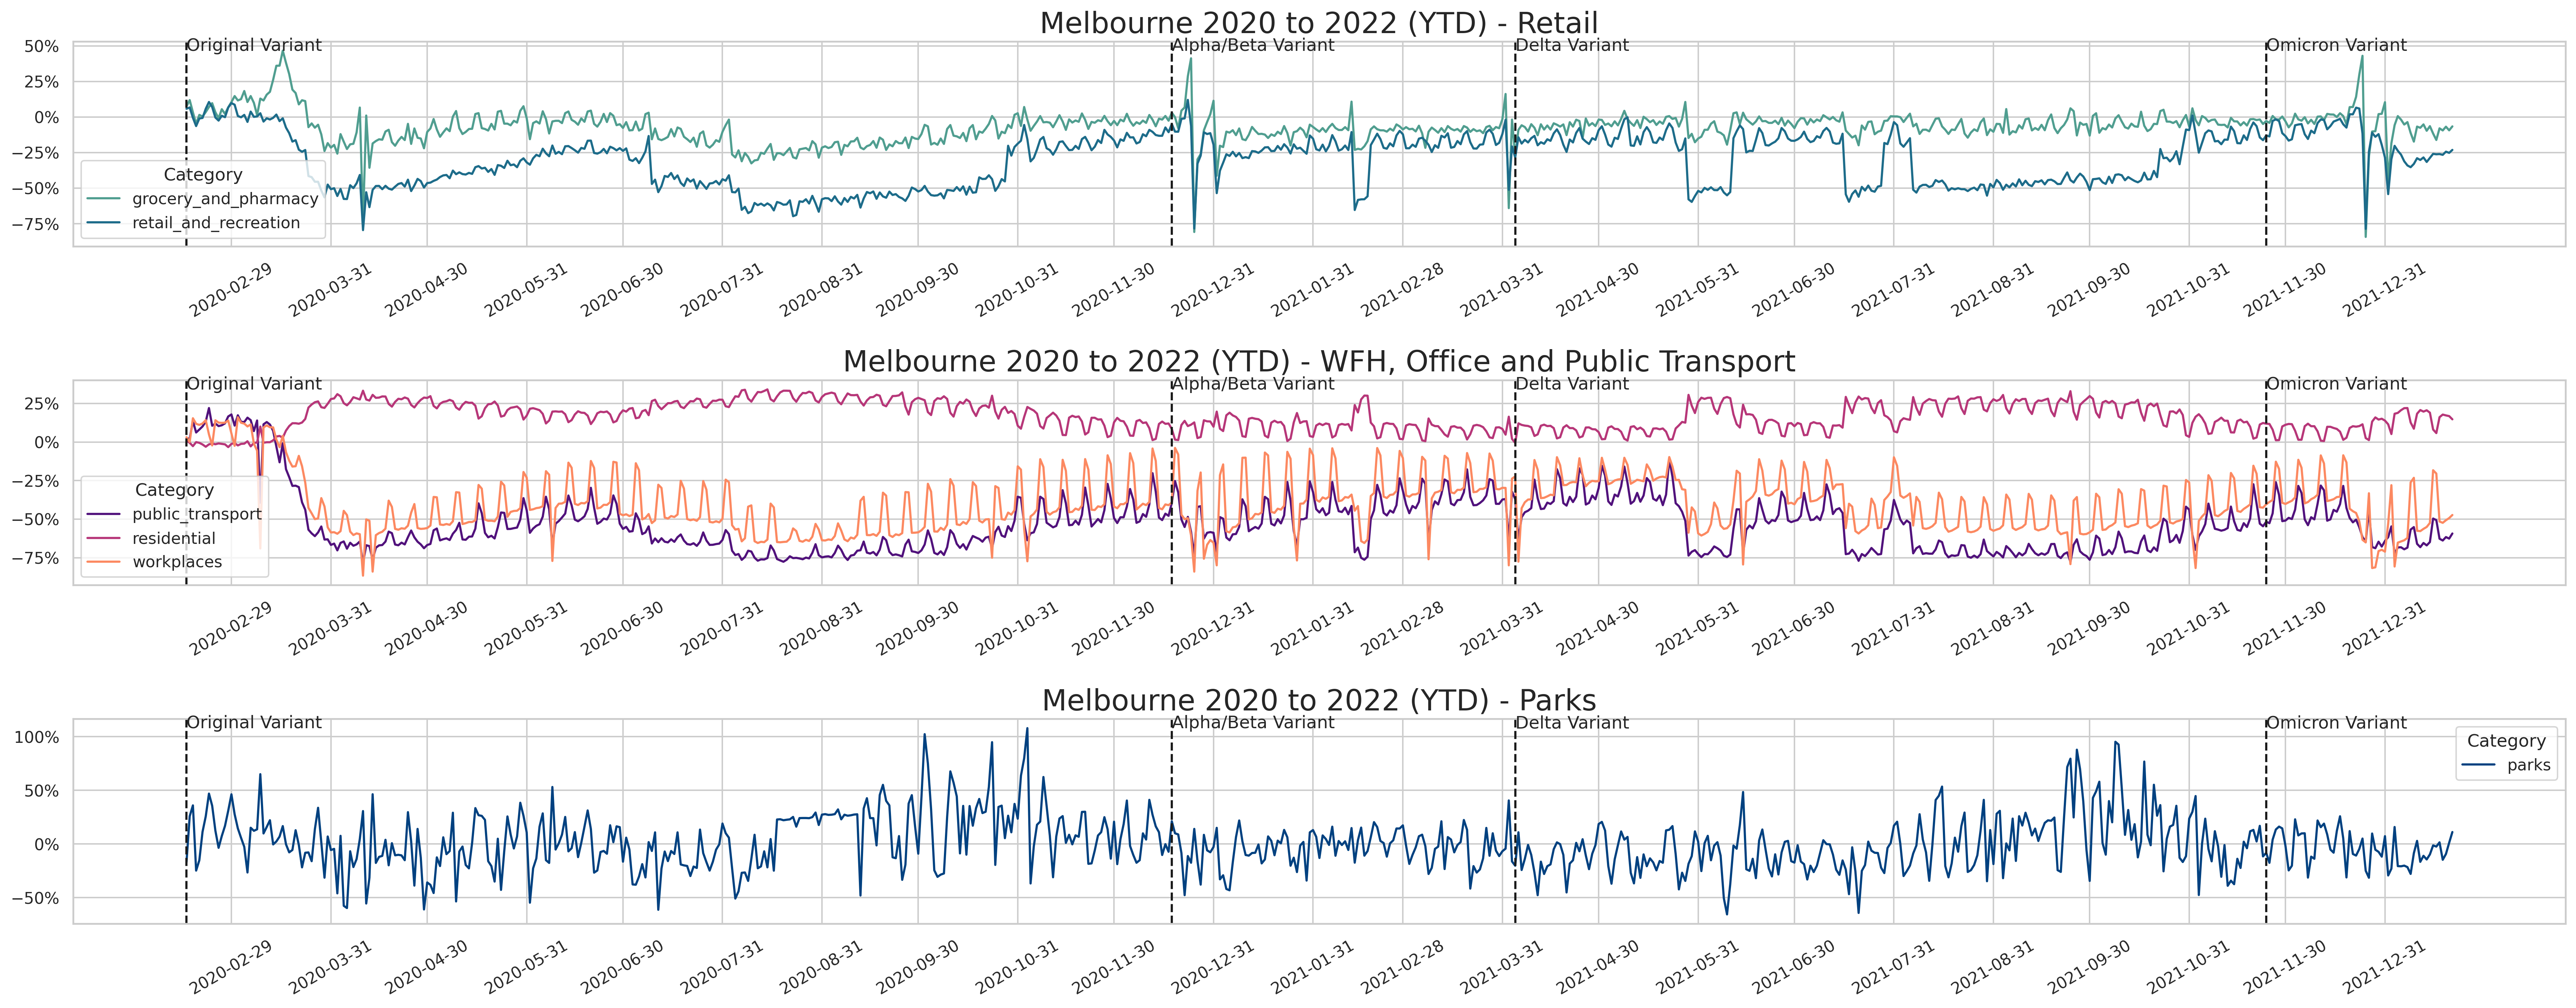 Melbourne Mobility during Pandemic
Image from my Kaggle notebook
Melbourne Mobility during Pandemic
Image from my Kaggle notebook
Immediate observations for Sydney and Melbourne:
-
Melbourne had a 2nd major lockdown from around June 2020 to October 2020. You can see retail traffic drop in these periods.
-
Melbourne had a 3rd major lockdown from around June 2021 to October 2021. Again, retail traffic drops.
-
Sydney similiarly had a major lockdown from around June 2021 to October 2021.
-
Like Brisbane, the Omicron variant has resulted in a de facto lockdown, with a reduction in traffic. However, the drop isn’t as noticable compared to Brisbane (likely due to lockdown fatigue as Melbourne was the city with the largest number of lockdown days in the world)
-
Traffic to parks, however, actually still dropped even during lockdowns.
Let’s zoom into groceries for a second - you will notice that panic buying sets in right before or after a new variant emerges:
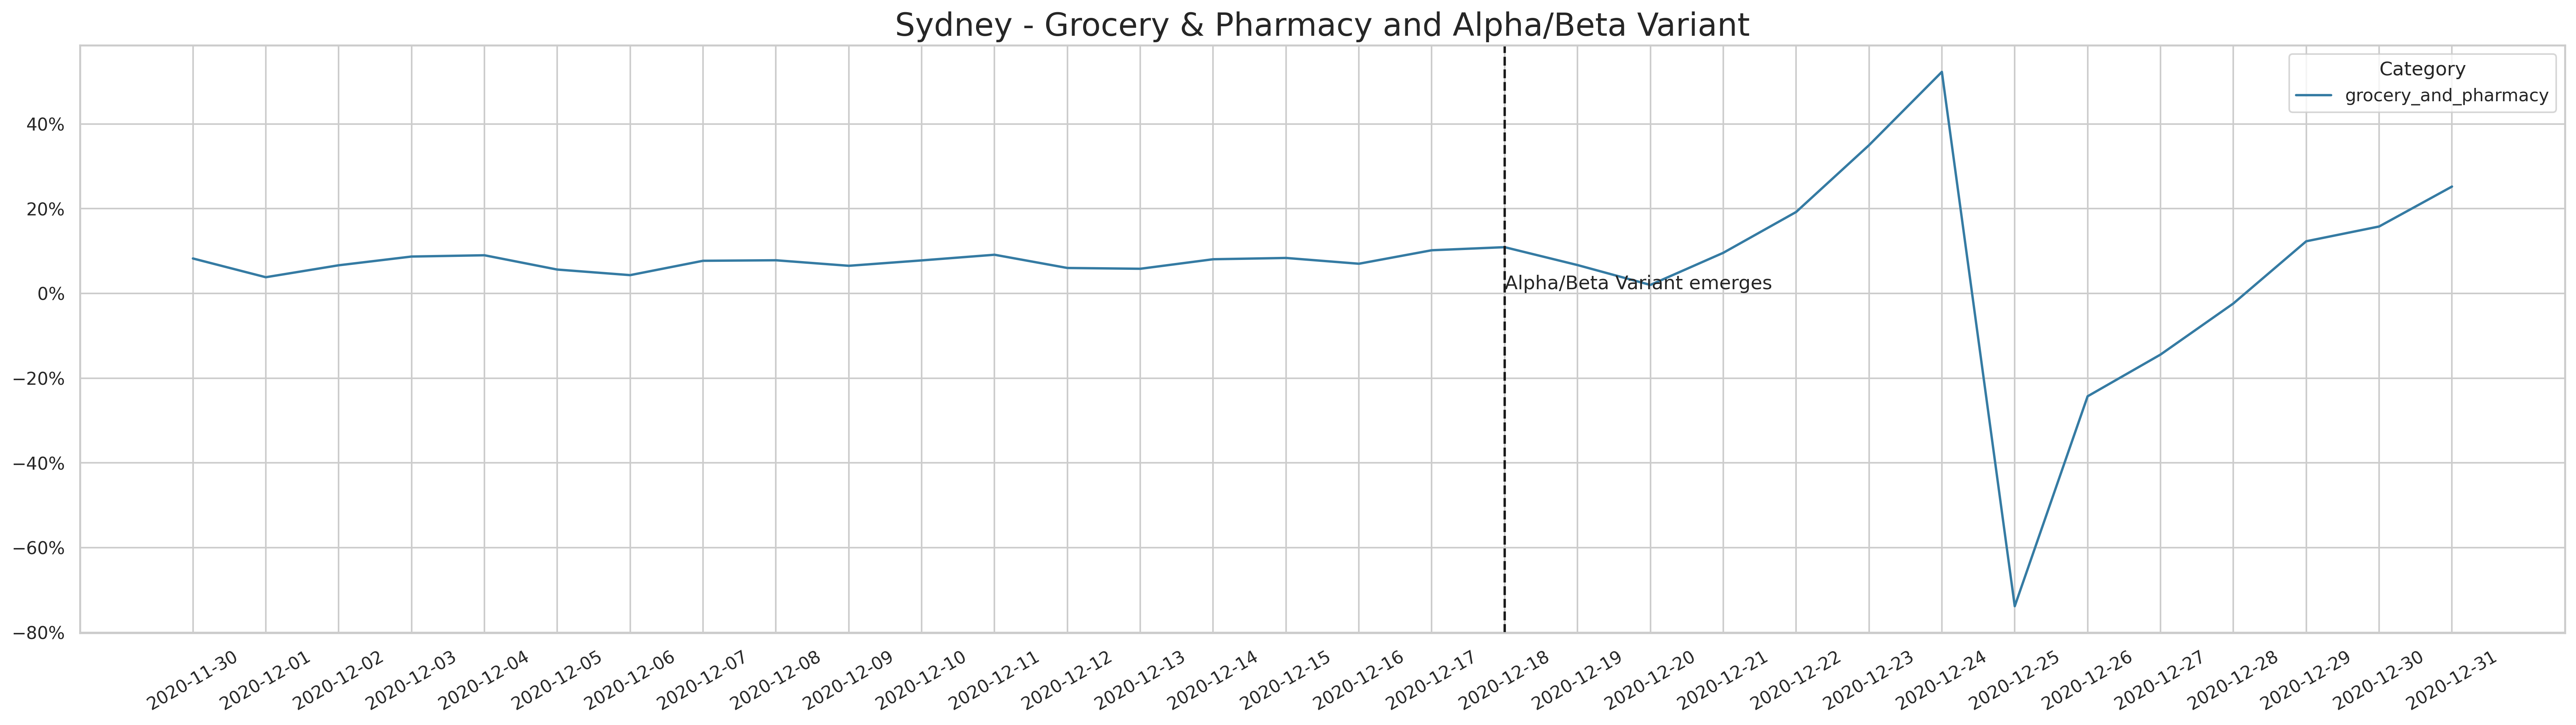 Sydney Grocery/Pharmacy Traffic - Alpha/Beta Variant
Image from my Kaggle notebook
Sydney Grocery/Pharmacy Traffic - Alpha/Beta Variant
Image from my Kaggle notebook
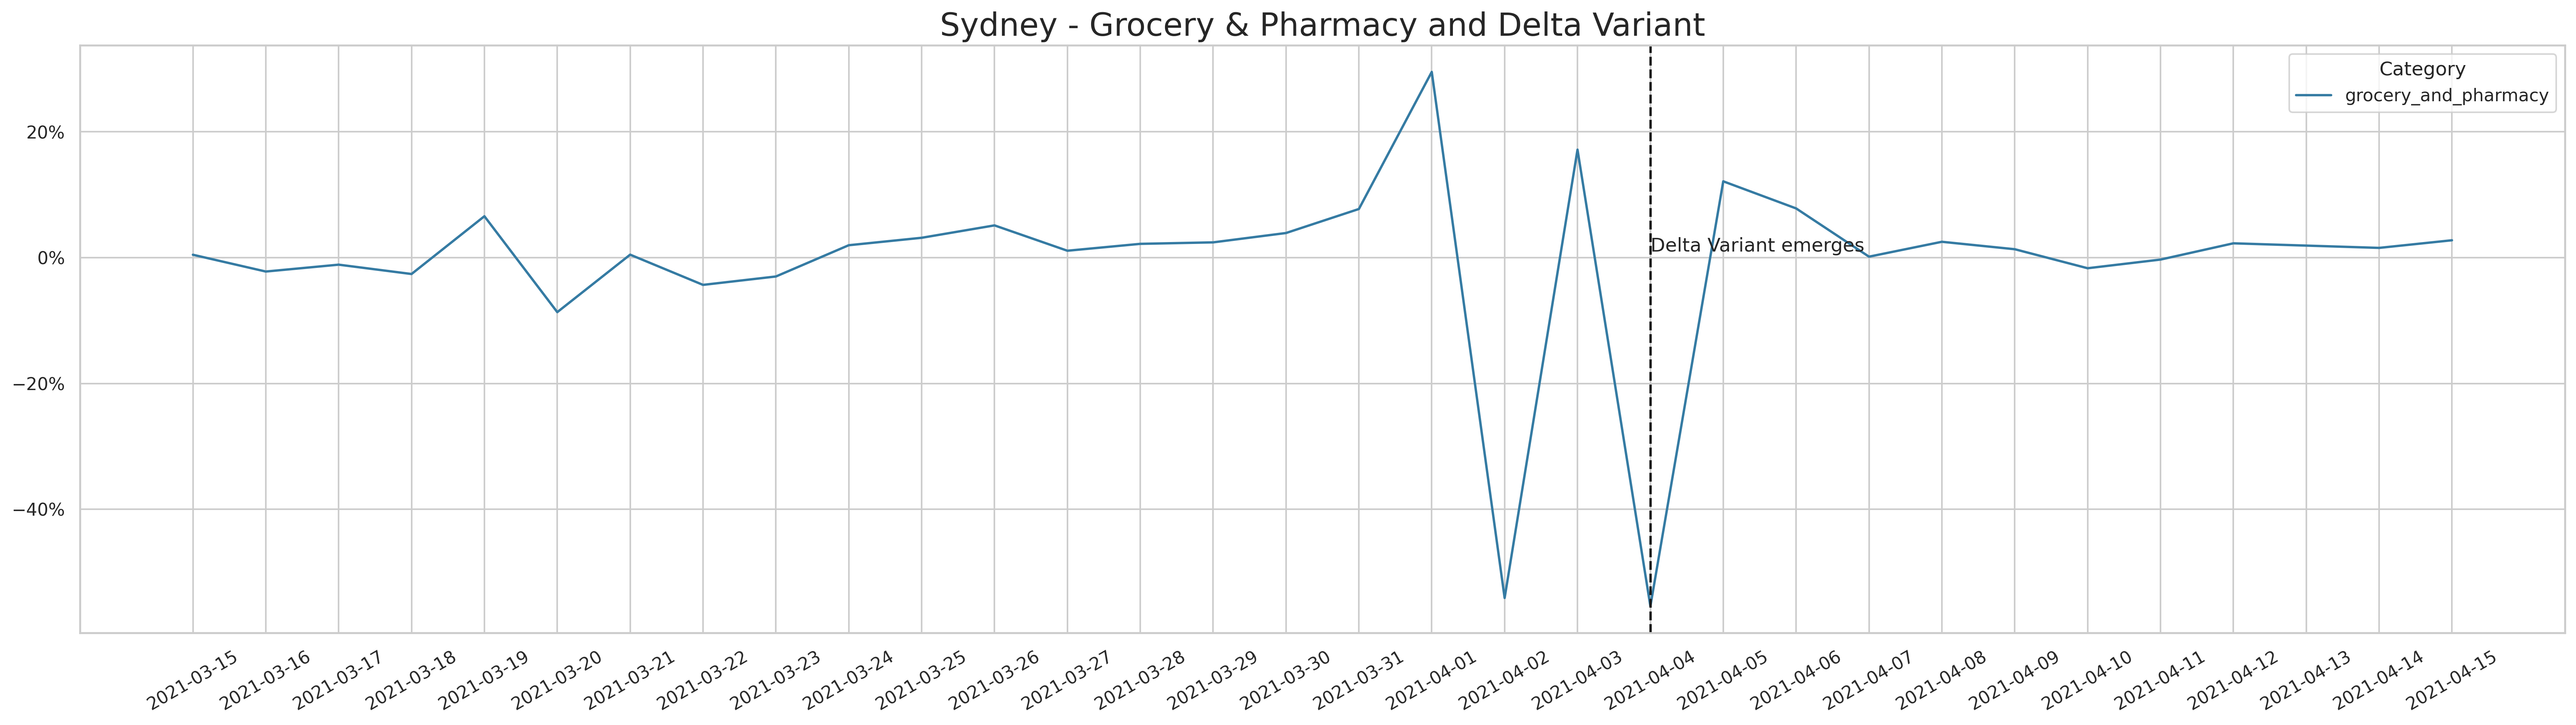 Sydney Grocery/Pharmacy Traffic - Delta Variant
Image from my Kaggle notebook
Sydney Grocery/Pharmacy Traffic - Delta Variant
Image from my Kaggle notebook
Also for workplaces, we’re seeing some form of strange seasonality, with a repeating spike. Let’s zoom in and have a look in more detail:
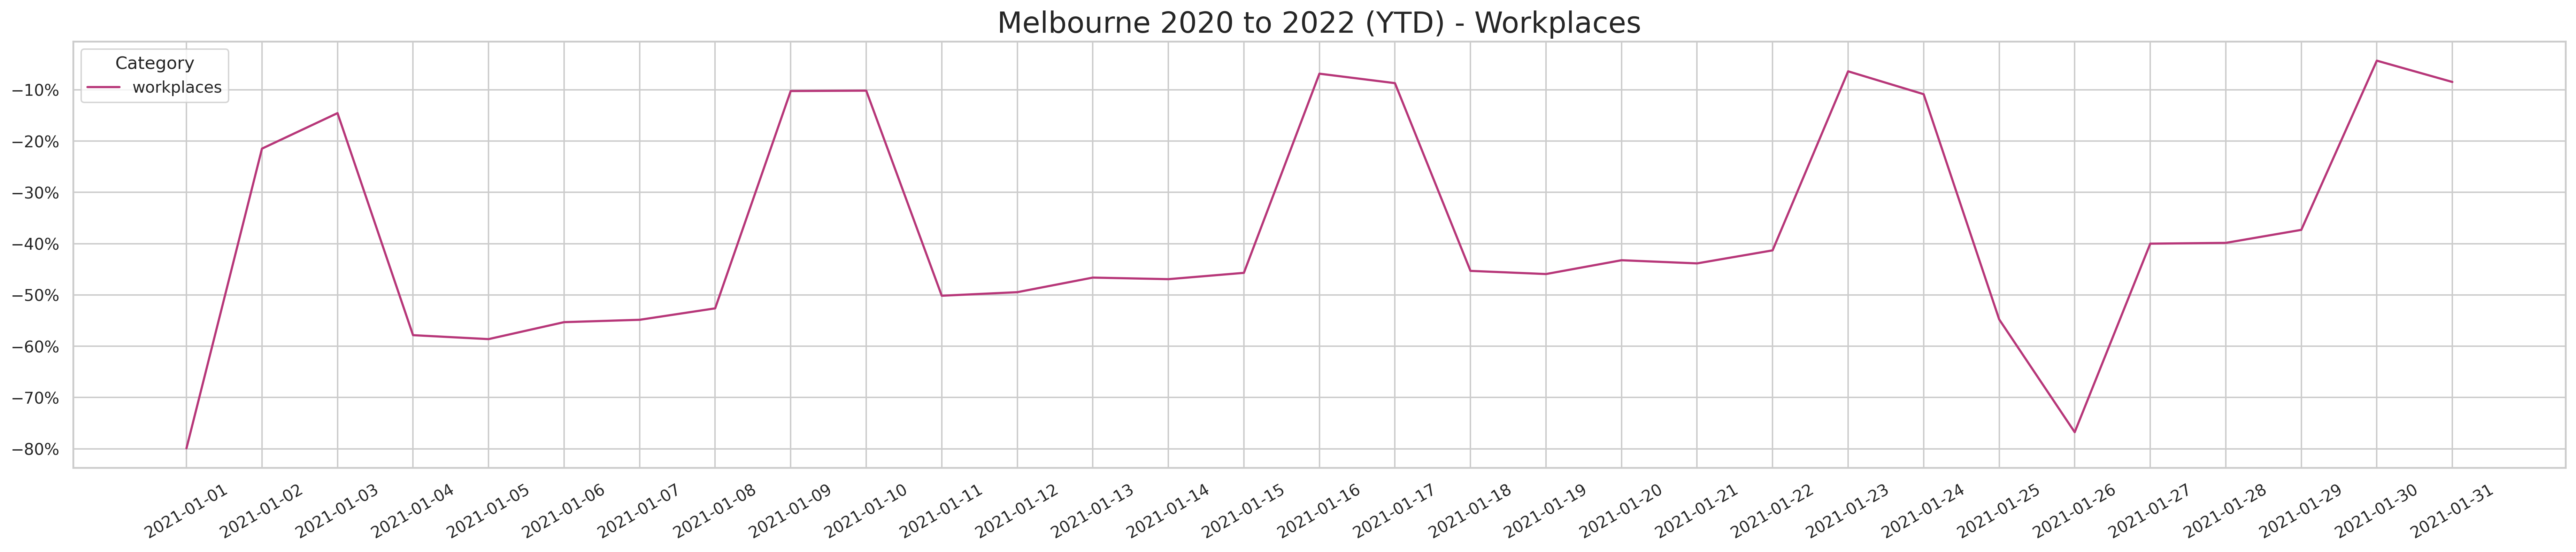 Melbourne Workplaces - January 2021
Image from my Kaggle notebook
Melbourne Workplaces - January 2021
Image from my Kaggle notebook
They are weekends! Whenever it’s a weekend, workplace traffic spikes. I can thinks of 2 explanations:
Google Mobility data may be misclassifying some cafes as ‘workplaces’ There’s more hospitality places open on the weekends and it is counting these weekend workers into the dataset
To determine whether there’s a trend of less workplace traffic compared to pre-pandemic, we can do a histogram of the workplace data.
If the data is centered around zero, it means there’s too much overall trend difference between pre-pandemic and pandemic. However, if the data is centered below zero, it means there’s an overall reduction in traffic.
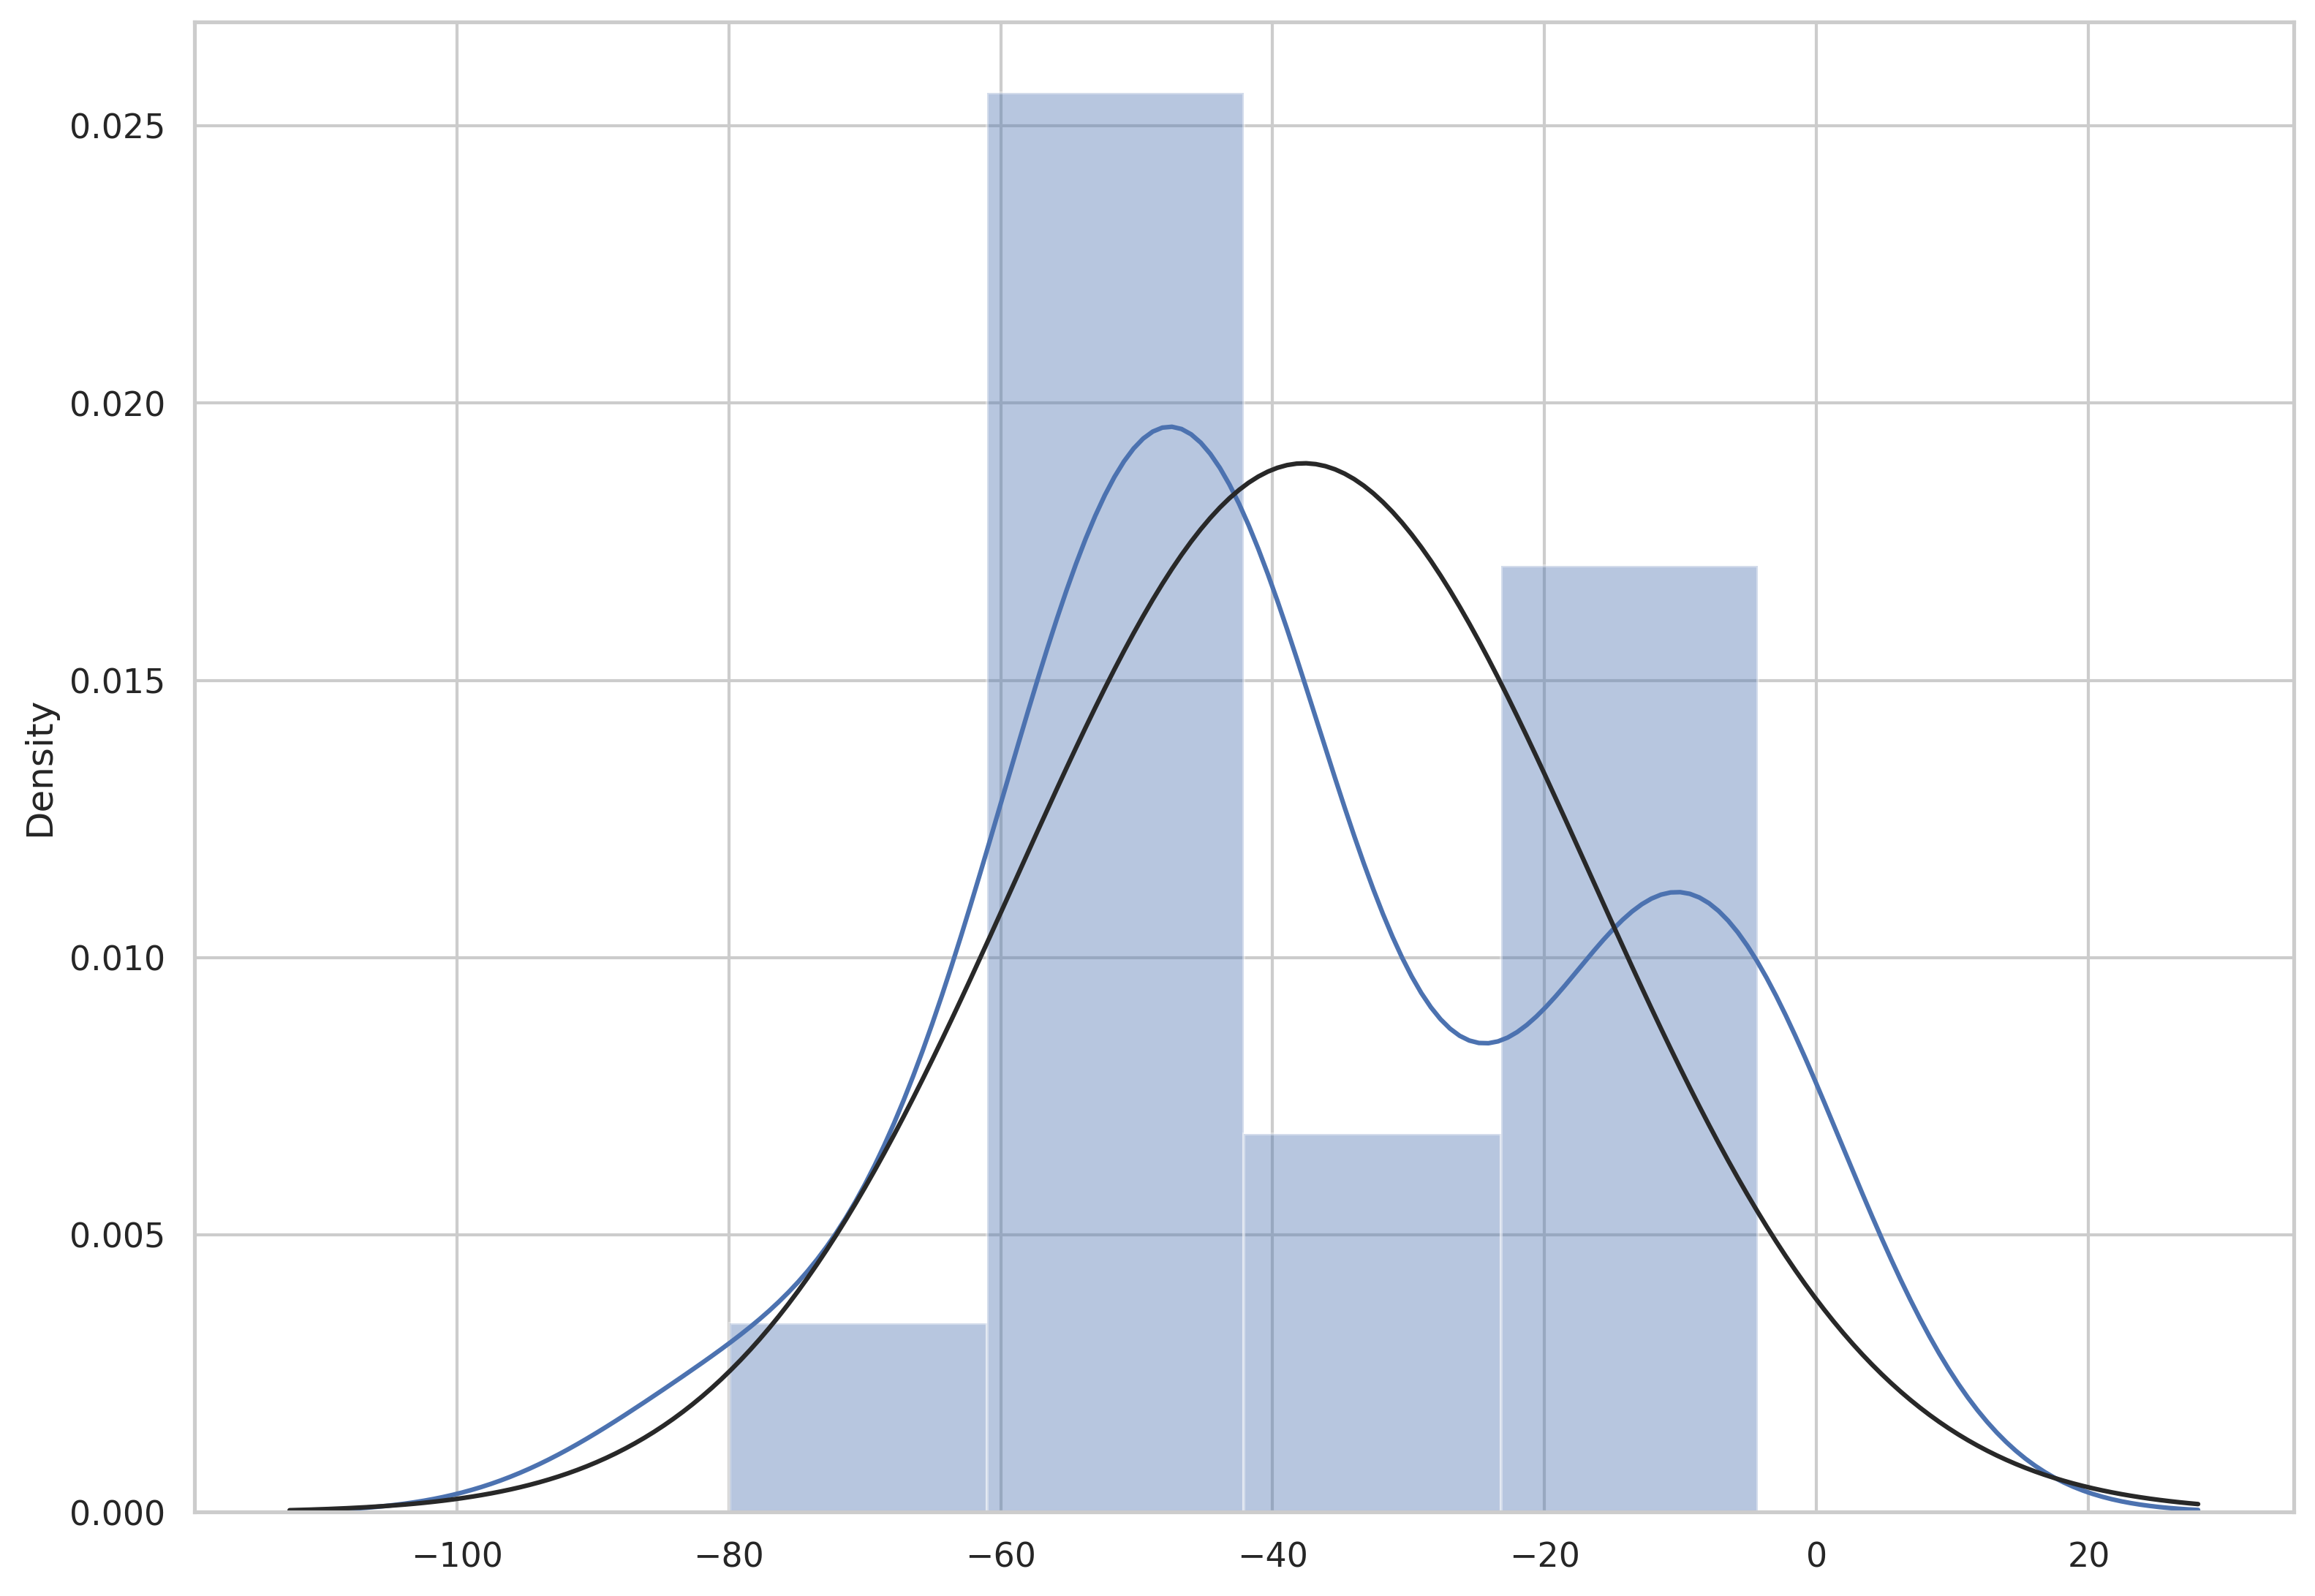 Melbourne workplace traffic - histogram
Image from my Kaggle notebook
Melbourne workplace traffic - histogram
Image from my Kaggle notebook
You can see that the histogram centres between -40 and -20, and definitely not 0. This confirms what we already suspect - traffic to workplace is lower than pre-pandemic days.
Singapore and Tokyo
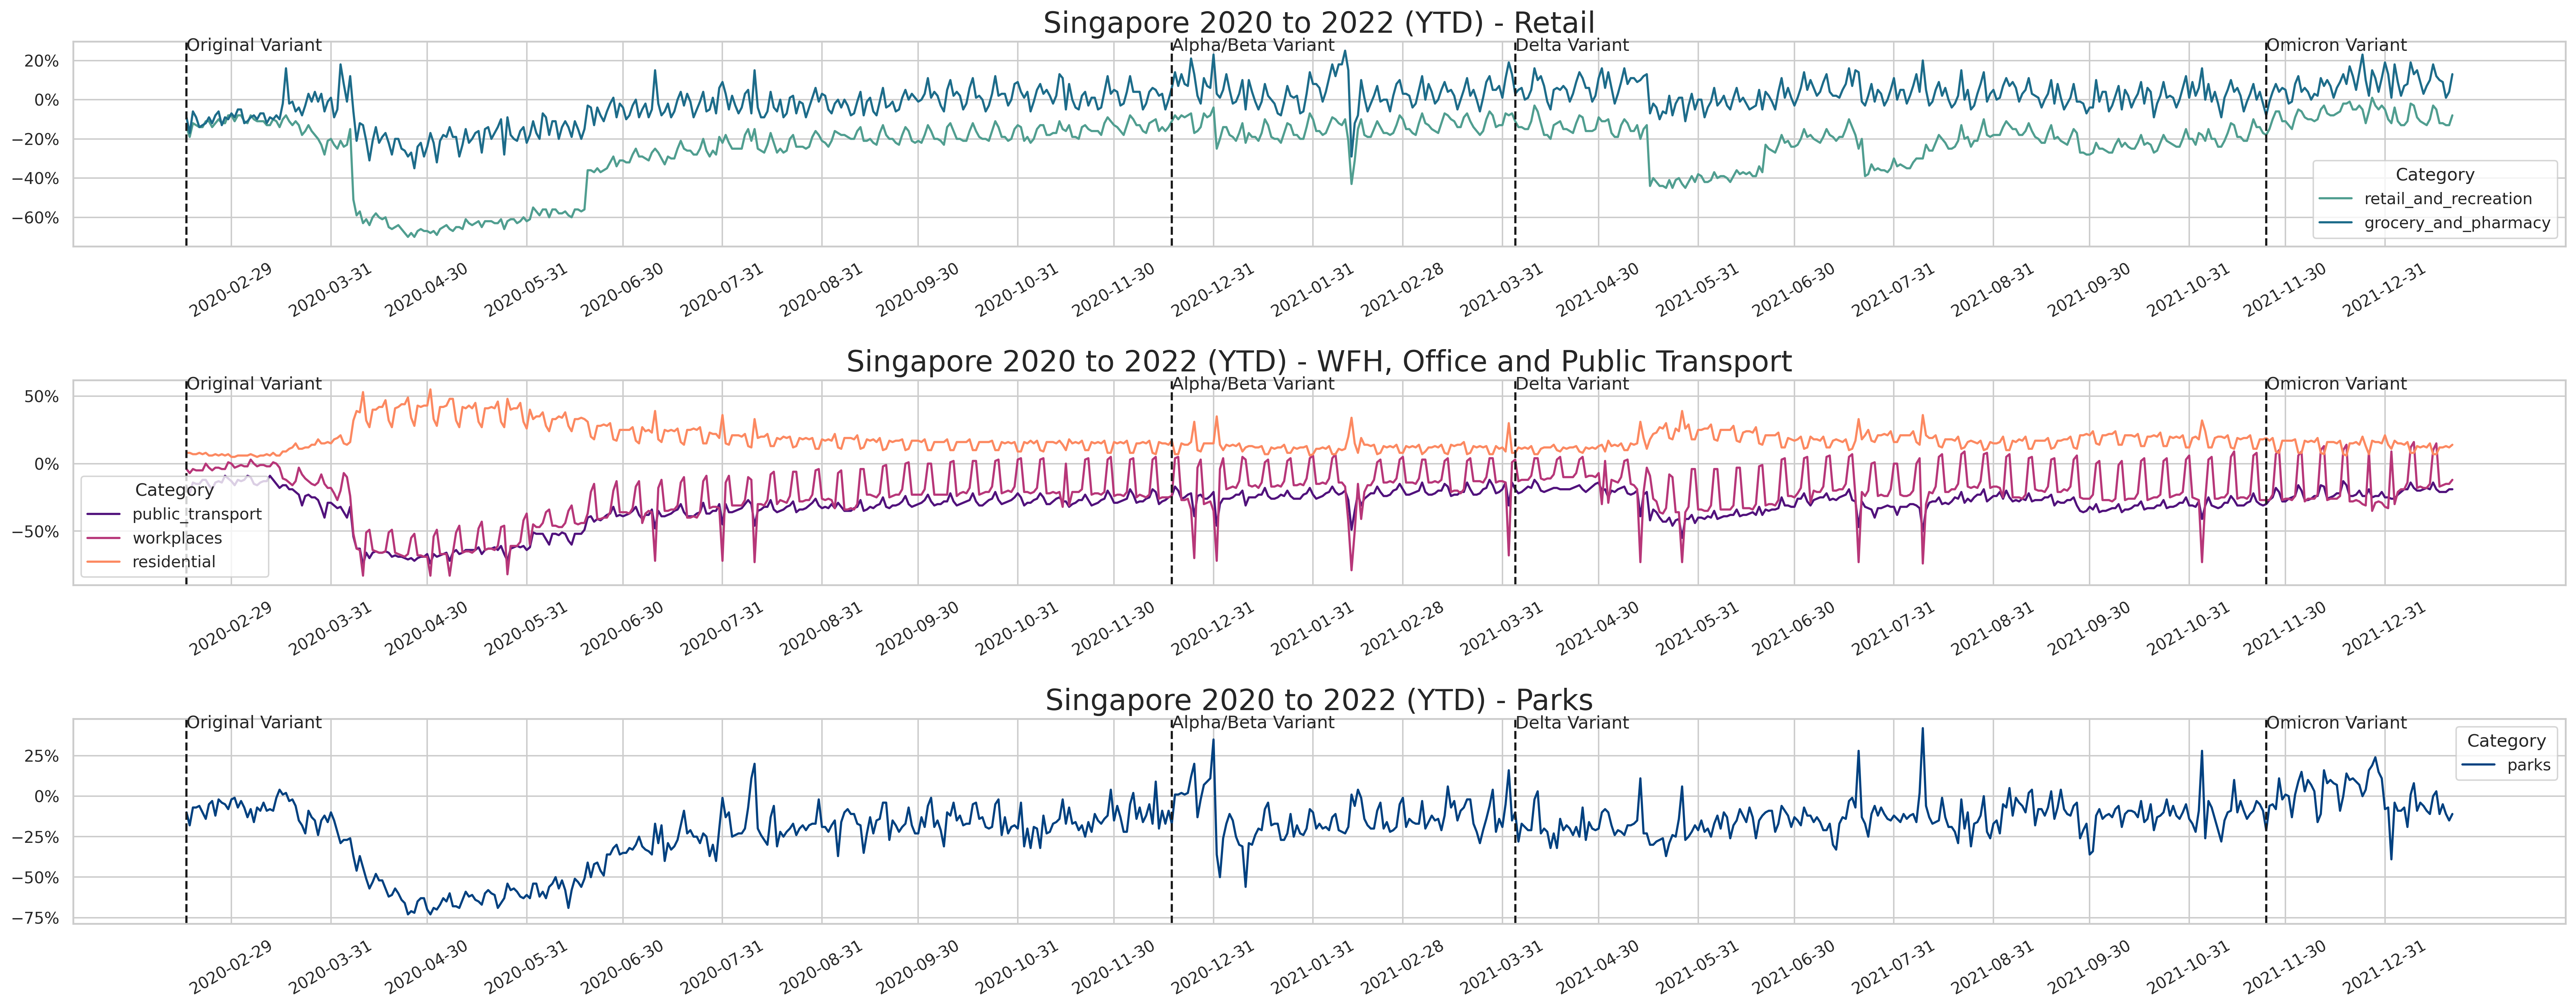 Singapore Mobility during Pandemic
Image from my Kaggle notebook
Singapore Mobility during Pandemic
Image from my Kaggle notebook
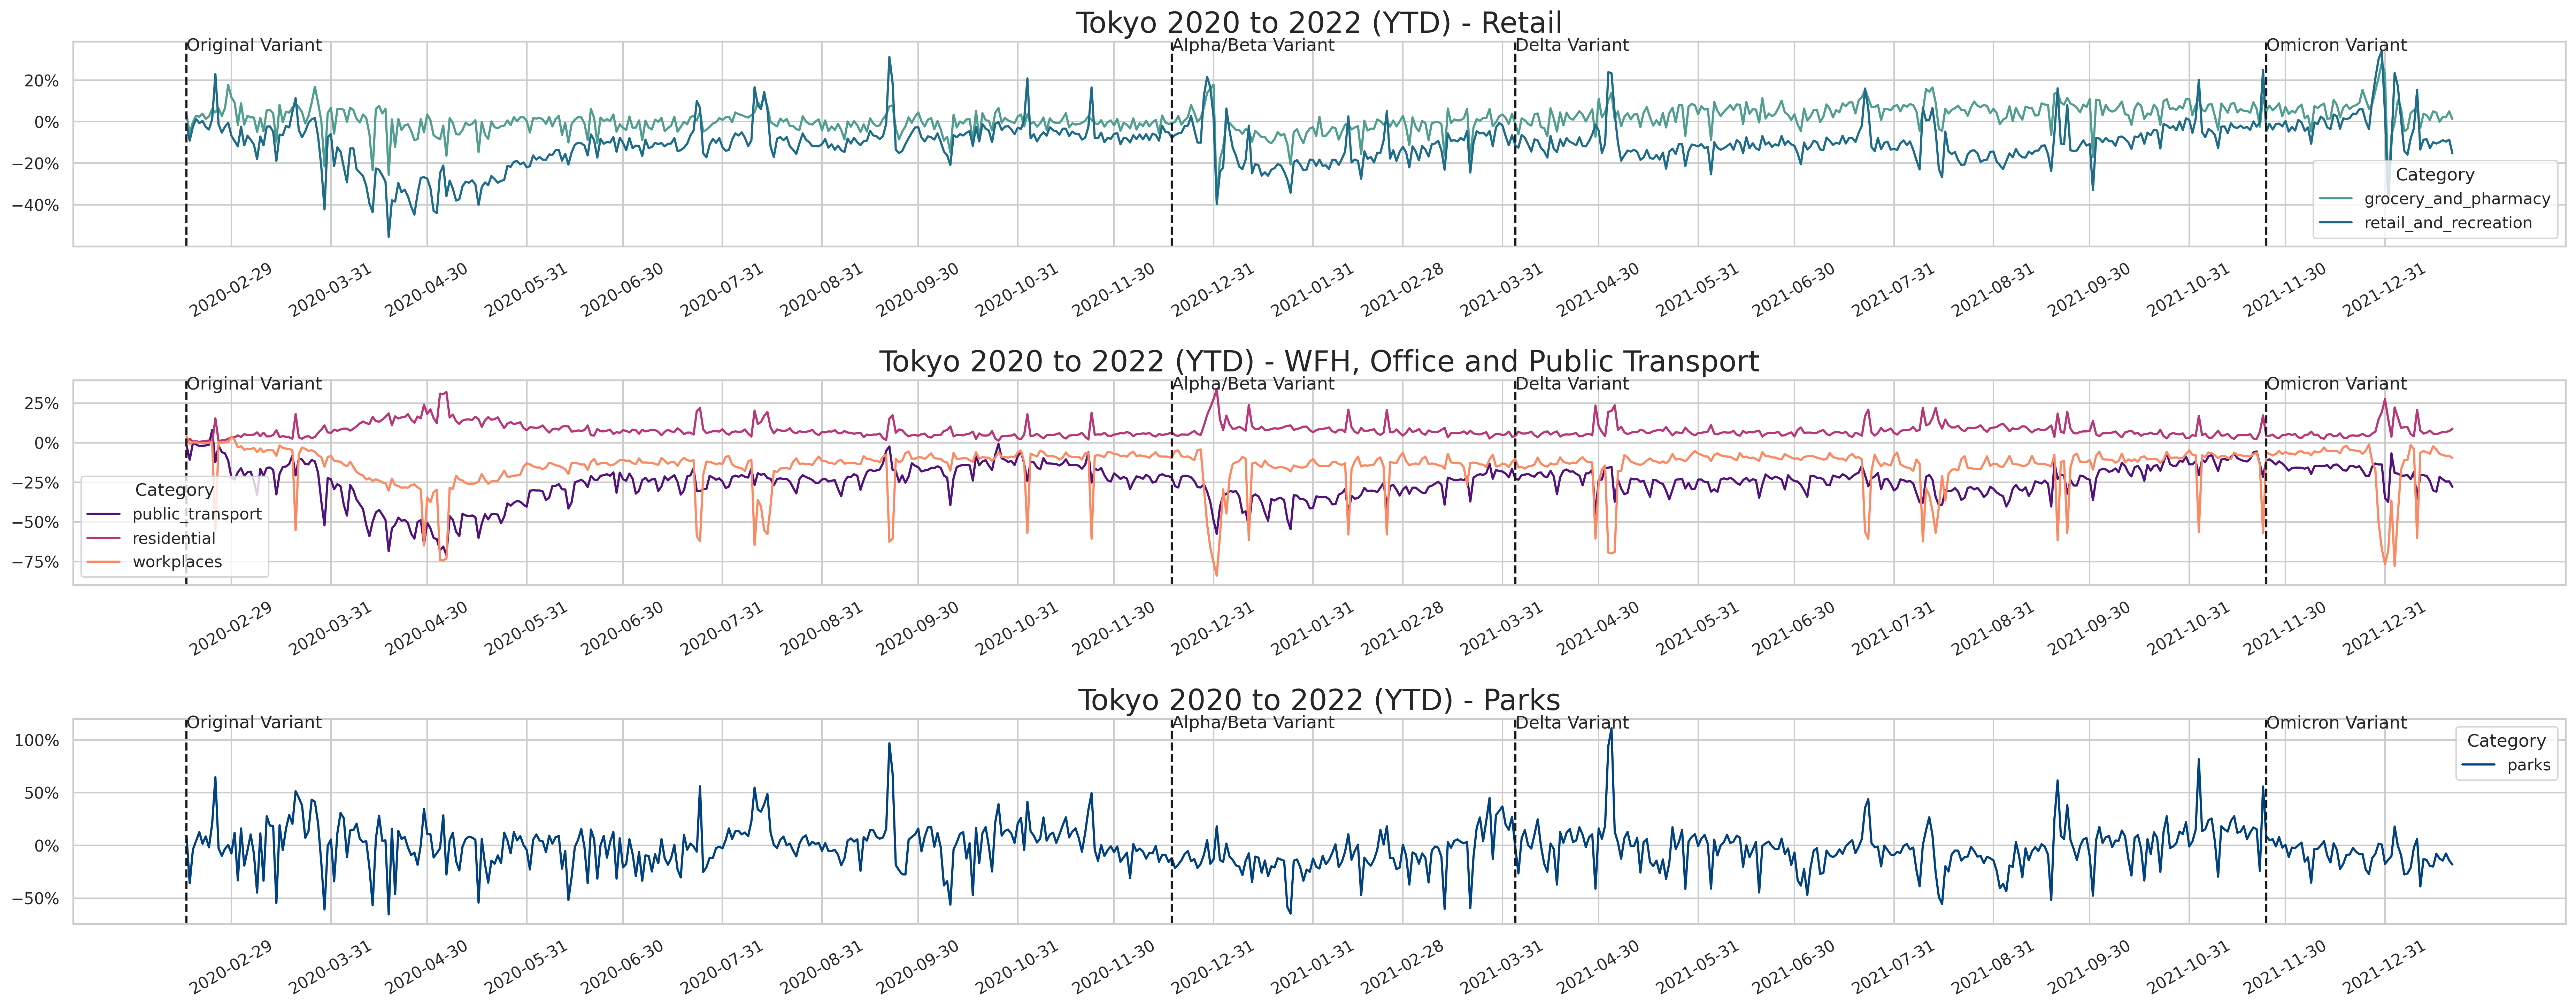 Tokyo Mobility during Pandemic
Image from my Kaggle notebook
Tokyo Mobility during Pandemic
Image from my Kaggle notebook
As sort of expected:
-
Besides the initial lockdown, Singapore and Tokyo traffic for offices has maintained roughly the same, almost to pre-pandemic levels. This is consistent with a cultural perception that being in the office is needed to be productive. This is in contrast between cultural acceptance of WFH/hybrid arrangements vs other cities (e.g. Sydney/Melbourne)
-
Park traffic hasn’t significantly changed after the initial lockdown
-
Pharmacy traffic significantly increased to even above pre-pandemic levels
-
Despite the 2021 Summer Olympics, Tokyo traffic didn’t significantly change for this period
New variants caused an initial dip in traffic, but it quickly recovered after that
New York City
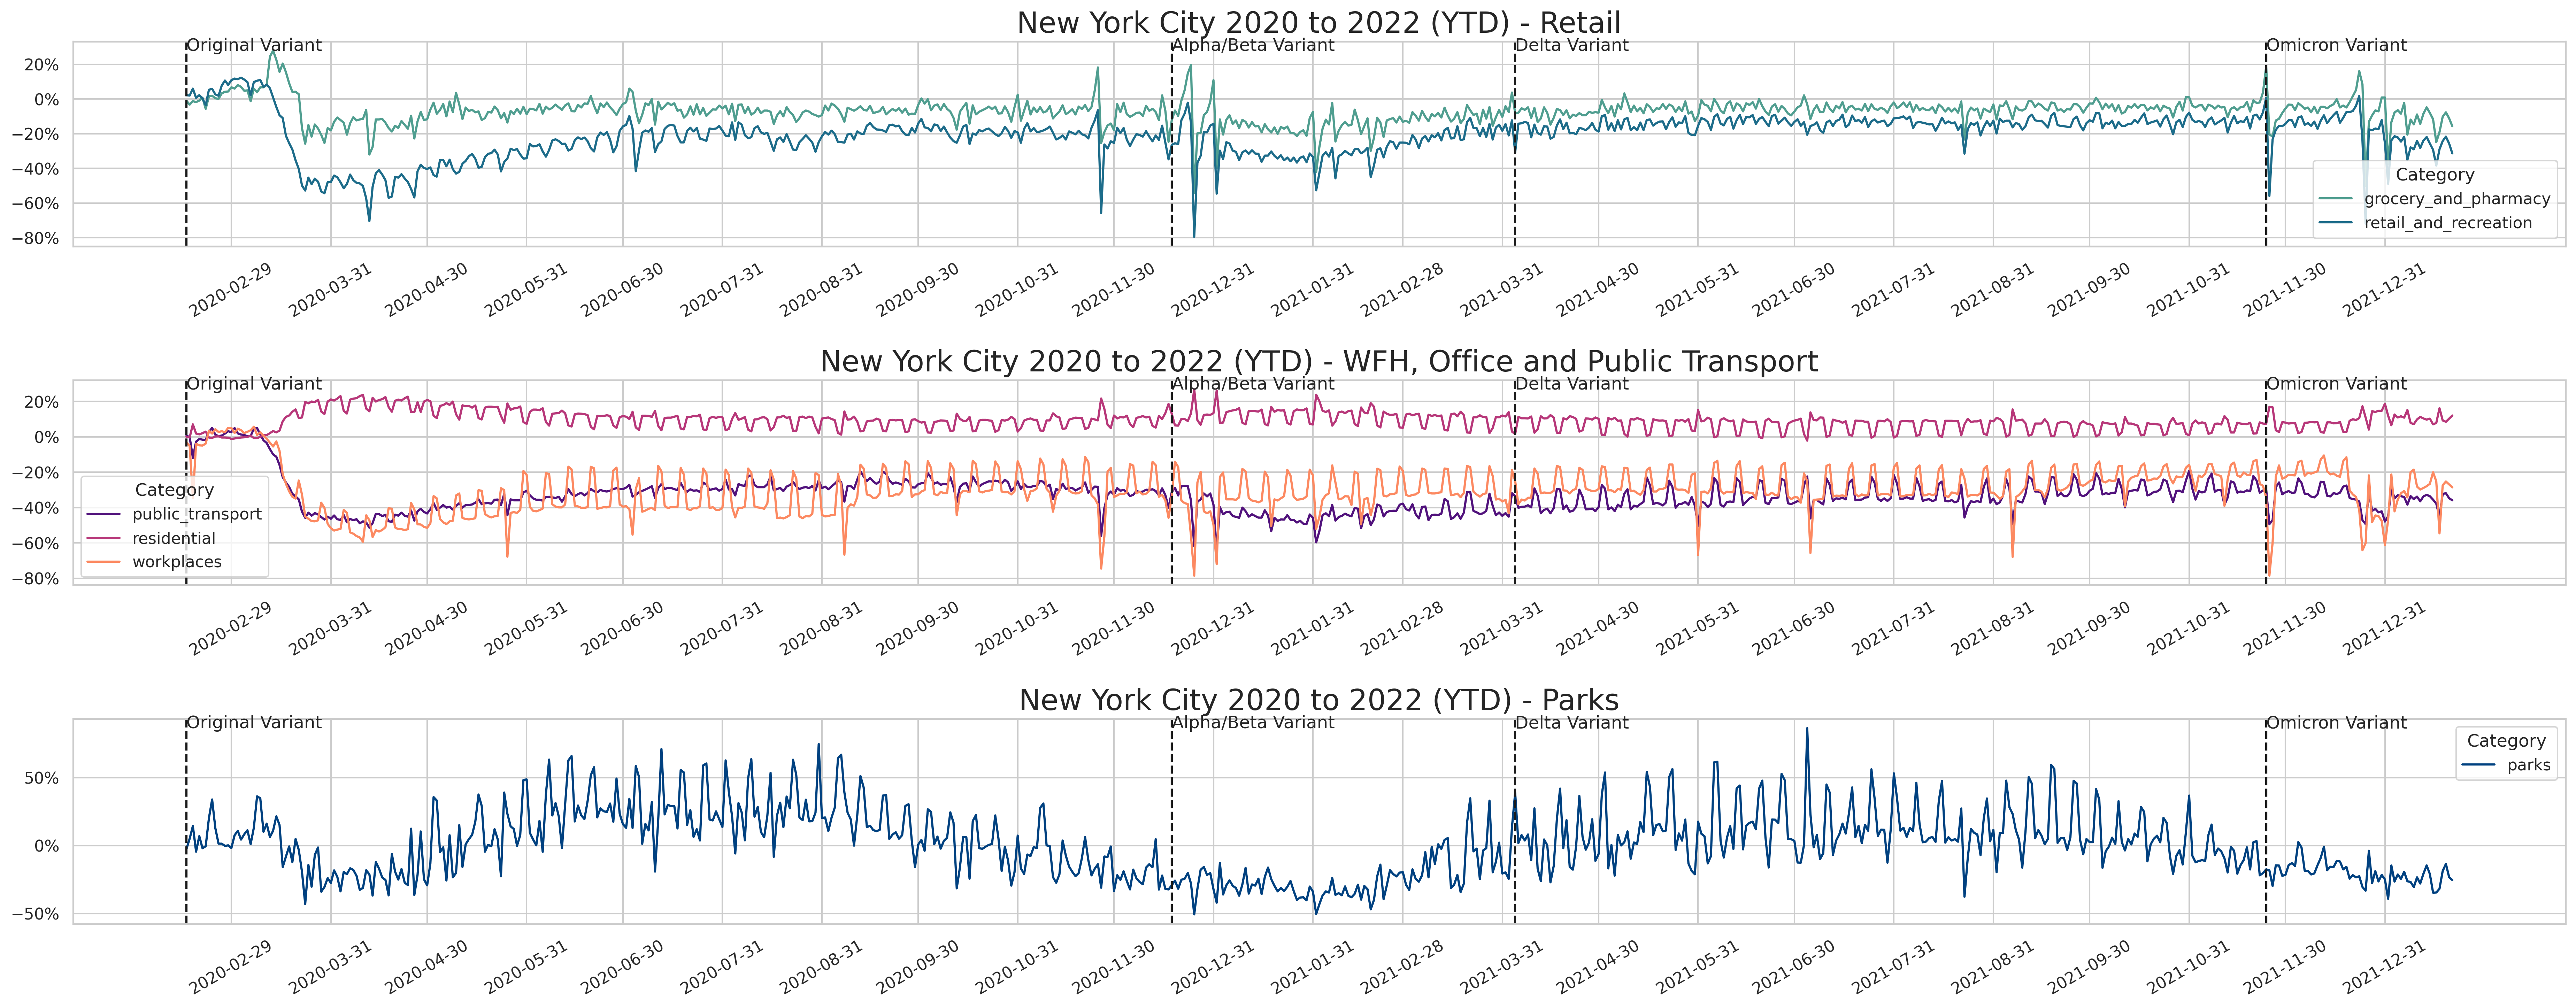 NYC Mobility during Pandemic
Image from my Kaggle notebook . Original dataset from Google COVID-19 Community Mobility Reports
NYC Mobility during Pandemic
Image from my Kaggle notebook . Original dataset from Google COVID-19 Community Mobility Reports
Observations for NYC:
-
Retail plummeted during initial wave, but bounced back to almost pre-pandemic levels (until Omicron)
-
There has been a steady increase of park traffic since the pandemic to even above pre-pandemic levels
Closing Thoughts
So after analysing traffic for these cities, it is interesting how government policy and cultural attitudes have shaped human traffic.
Interestingly a few points:
-
For most cities, absent of a government-mandated lockdown or restrictions, traffic is not significantly changed for workplace and public transport
-
However, in Australian cities, you can see de facto lockdowns occurring even in absence of government restrictions.
-
In certain cities, you can see panic buying happening as well when a new variant merges.
-
There’s a strong correlation between public transport patronage and number of people going to office/workplace vs working-from-home.
 Photo by Miguel Montejano from Pexels