Property or Shares?
There’s the old adage that property is a good long-term investment. But shares are also a good investment too!
This blog will attempt to use a data-approach to answer the question: is property or shares a better investment in the long-run?
Updated on 16 June 2020: included latest March 2020 RRPI data from ABS.
 The fight is on!
Photo by Peter Dargatz from Pixabay
The fight is on!
Photo by Peter Dargatz from Pixabay
Disclaimer and Analysis Assumptions
Before we dive in I just wanted to covered off a few things
First is the general disclaimer that this article doesn’t constitute financial advice and may not suit your own personal financial circumstances.
Also, I note the following assumptions and parameters about this analysis:
-
This hypothetical scenario is if you had extra capital to invest and you were equally able/liquid to invest the each same in amount in either shares or property (investment property, not owner occupier)
-
Following on from that, ease of access to capital and loans is not considered. For example, it may be easier to secure more capital (e.g. home loan) for property investment, as opposed to shares (e.g. margin lending).
-
Tax incentives are not considered (e.g. negative gearing for property)
-
Rental and dividend income is not considered - focus is purely on capital growth - i.e. which investment will have a greater capital gain.
-
Holding costs and expenses are not considered - for example, property maintenance.
-
Property is mainly focused in residential dwellings (e.g. apartments, houses) not commercial property (e.g. factories, office buildings)
Lastly, a more things to remember with any type of investment analysis:
-
Individual properties and shares may perform vastly different to the market average. You could get really lucky or unlucky!
-
‘Past performance is not necessarily indicative of future returns’, so unique circumstances in the share or property markets may not repeat again!
Now that we’ve got that covered off, let’s move onto the datasets I used.
Background on the Datasets
The two main types of data sources I will use to answer this hypothesis are: S&P ASX 200 Index and the ABS Residential Property Price Indexes.
S&P ASX 200 Index (XJO)
The Standard & Poor’s Australian Stock Exchange (S&P ASX) Index is a measurement provided by S&P that tries to capture the overall performance of the ASX. ‘200’ refers to the Top 200 companies by market capitalisation (i.e. total value of shares in circulation) listed in the ASX.
Indices are widely adopted and used to measure the overall performance of the share market and there are ones for other markets (e.g. Dow Jones Industrial Average Index).
The ASX 200 is used (instead of 300) as it is the main investable benchmark of the ASX and therefore most widely used to benchmark the ASX market performance.
As a side note, the Top 10 companies in the ASX 200 actually represent almost 40% of the total market capitalisation of the ASX. These companies are massive!
In particular, I will use the Adjusted Closing Price, which is a common metric used to measure the daily performance of a share/index. It is the closing price adjusted to factor in dividends (e.g. if a share had a $100 closing price and paid a $5 dividend, the adjusted closing price would be $95). The adjustment makes the price more accurately reflect the true ‘value’ of the index/stock.
Note the ASX only trades on working days, so therefore weekends, public holidays won’t have any data.
Data is obtained from Yahoo Finance for period 23 November 1992 to 8 May 2020.
ABS Residential Property Price Indexes (RRPI)
The Australian Bureau of Statistics publishes the RRPI for the 8 capital cities of Australia’s States and Territories. Australia is unique in that the majority of the population lives in these 8 capital cities. Therefore, the ABS considers the capital city prices as a good proxy for prices in the entire respective State/Territory.
The scope of the RRPI is it only:
- includes 'Residential' properties, excluding commercial purposes
- is for properties in Greater Capital City Statistical Area - e.g. ‘Brisbane’ city includes Logan, which is technically a different city
Two datasets we will focus on from the RRPI:
-
Table 1 - RRPI itself - an aggregation of the Established Housing Price Index (HPI) (for detached houses) and Attached Dwelling Price Index (ADPI) (for attached dwellings, e.g. apartments), which measures the price change in all residential dwellings within the 8 capital cities.
-
Table 6 - mean price of residential dwellings for the 8 capital cities.
The RPPI is calculated on the reference base of 2011-12's housing prices (100.0) for each of the 8 capital cities as well as a weighted average of the nation.
The data is a combination of data from CoreLogic (formerly RP Data), which compiles real estate sales data, the Census of Population and Housing (for number of houses) and each State/Territory’s Land Titles Offices or Valuers General Office.
Data for RRPI is from 30 September 2003 to 31 March 2020 - the data is published by the ABS 3 months in arrears - e.g. 31 March 2020 figures are published in June 2020.
The data for average housing prices is only from 30 September 2011 to 31 March 2020.
Technology Stack
Google Cloud BigQuery
In terms of the technology stack I used, the main workhorse in this analysis is Google Cloud BigQuery, which is a serverless, highly scalable, and cost-effective cloud data warehouse that allows you do SQL-based analysis.
BigQuery is part of the Google Cloud Platform (GCP), which is a major cloud provider that powers many Fortune 500 companies (e.g. PayPal, Spotify). Google also uses for its own services (e.g. Gmail, Google Calendar and YouTube). There's even integrations between Google Analytics and BigQuery!
Serverless means that you don't need to provision clusters, servers or nodes. BigQuery auto scales the underlying hardware resources so it automagically will give you more processing if you have a larger query.
There’s automatic replication across different Google data centres throughout the world under the hood, as well as automatic backup and snapshot of data to ensure high availability and reliability.
Also, as a neat feature, data older than 90 days is classed as ‘long-term’ and automatically moved to a more cost-effective storage.
Best of all, the pricing is pay-as-you-go, so there’s no upfront costs! There's also a free tier for BigQuery too!
All this means you can focus writing on SQL without having to worry about infrastructure, database administration and disaster recovery. You just simply log into the GCP BigQuery Web UI and you can start writing SQL just like that - don’t even need to wait for a server to start up!
Mode Analytics with BigQuery
For data visualisation, I used Mode Analytics, a cloud-based data analytics/science platform supporting SQL, Python and R to perform collaborative data analytics/science.
It supports data visualizations, dashboards/reports which can be created via easy drag and drop web UI. Furthermore, it has built-in integrations with major data technologies, including BigQuery.
For me, the biggest benefit with Mode Analytics is how quick you can go from connecting to a Big query table to developing cloud-based data visualizations that look good and are interactive.
Mode has a free-tier and is really great to get quick data visualisations that look pretty decent!
 Mode Analytics and Google Cloud BigQuery
So now onto the actual data part!
Data Analytics
Data preprocessing
The CSV data for the above was compiled and transformed using Python before being uploaded to GCP BigQuery for analysis.
The data staged and transformed in BigQuery is in three datasets below:
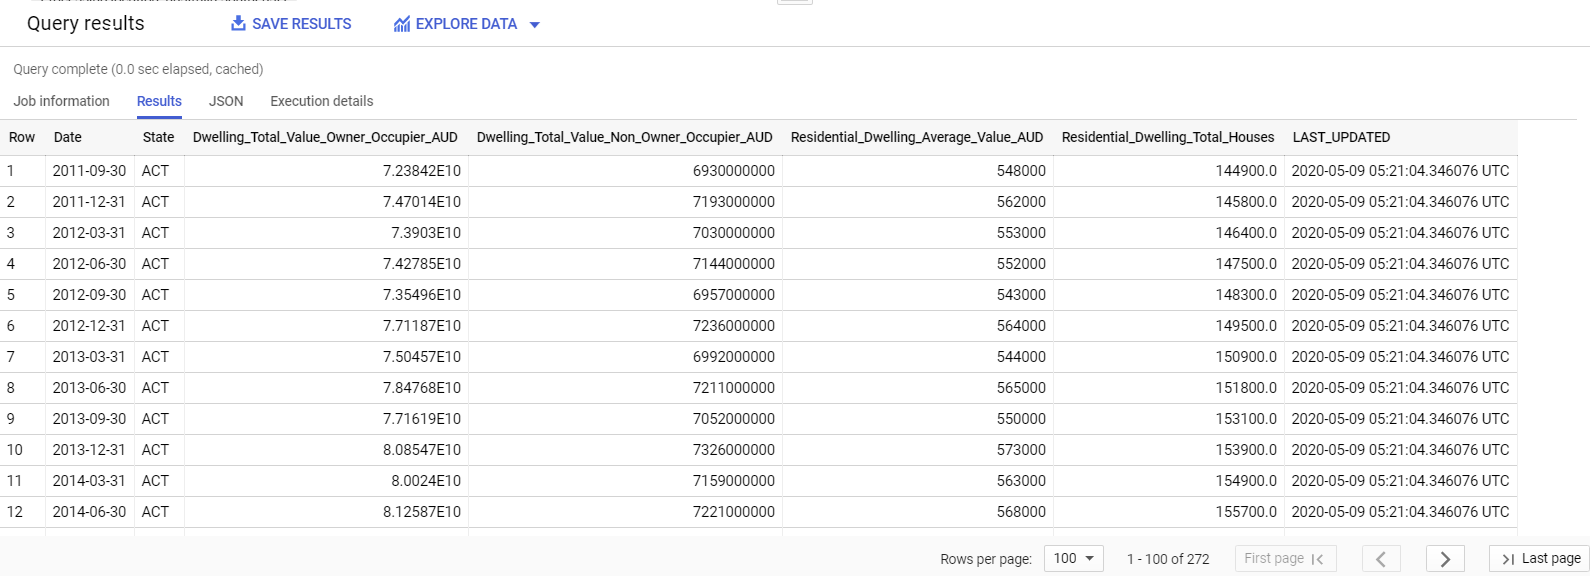 ABS Average Housing Price Data
 ABS RRPI Data
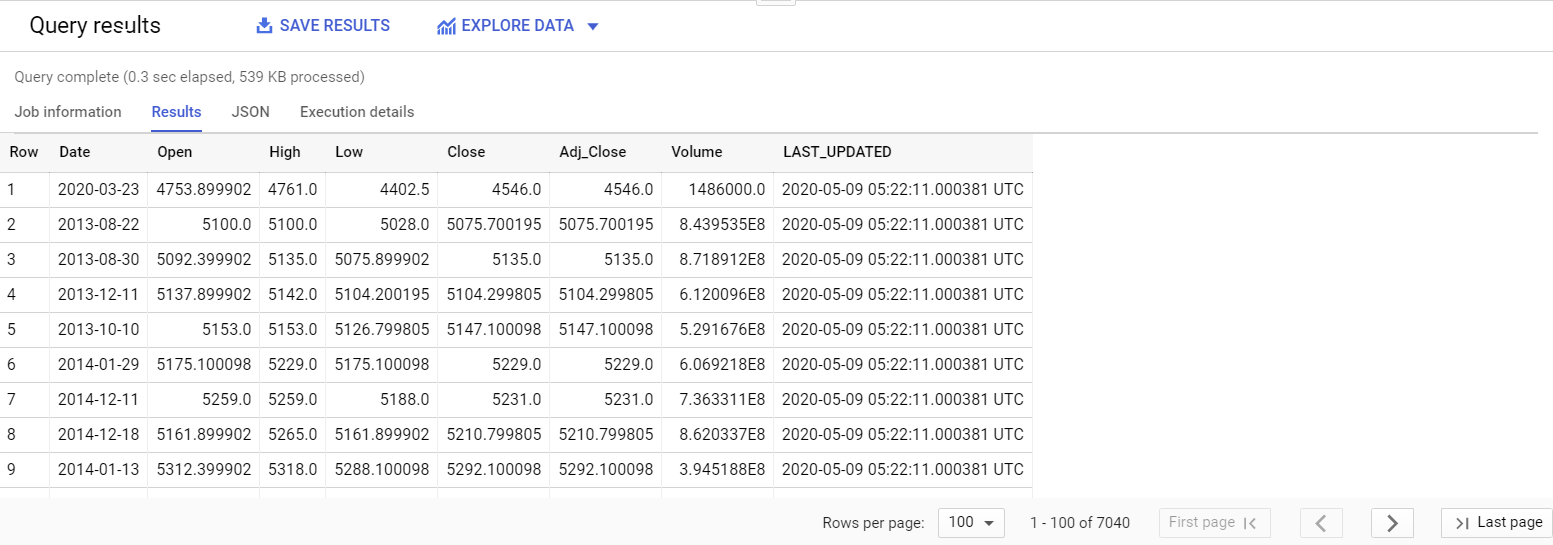 ASX 200 Data
Exploratory Data Analysis
Next, we have a better look at our datasets to understand it a bit more.
Australian Property Prices
First, for property, we’ll compare the States/Territories to see which one had the most growth. To find that out, we do this:
The results are as follows:
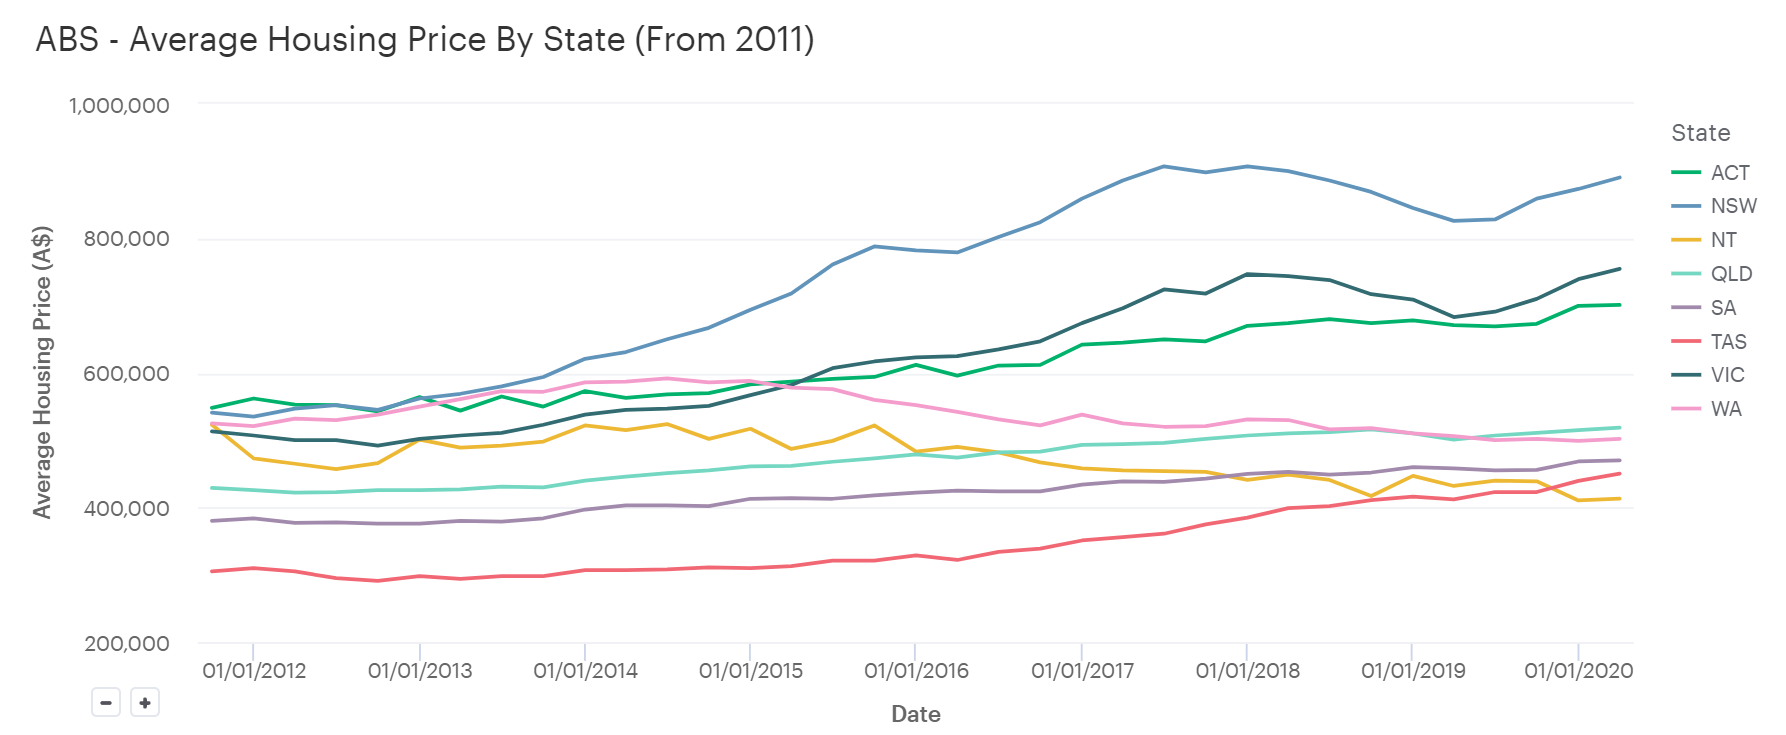 Average Housing Prices by State (in AUD)
As you can see, the highest average property prices were in NSW. However, we want to see the actual cumulative percentage growth of each State. That way, we can see how much each State grew and compare apples with apples:
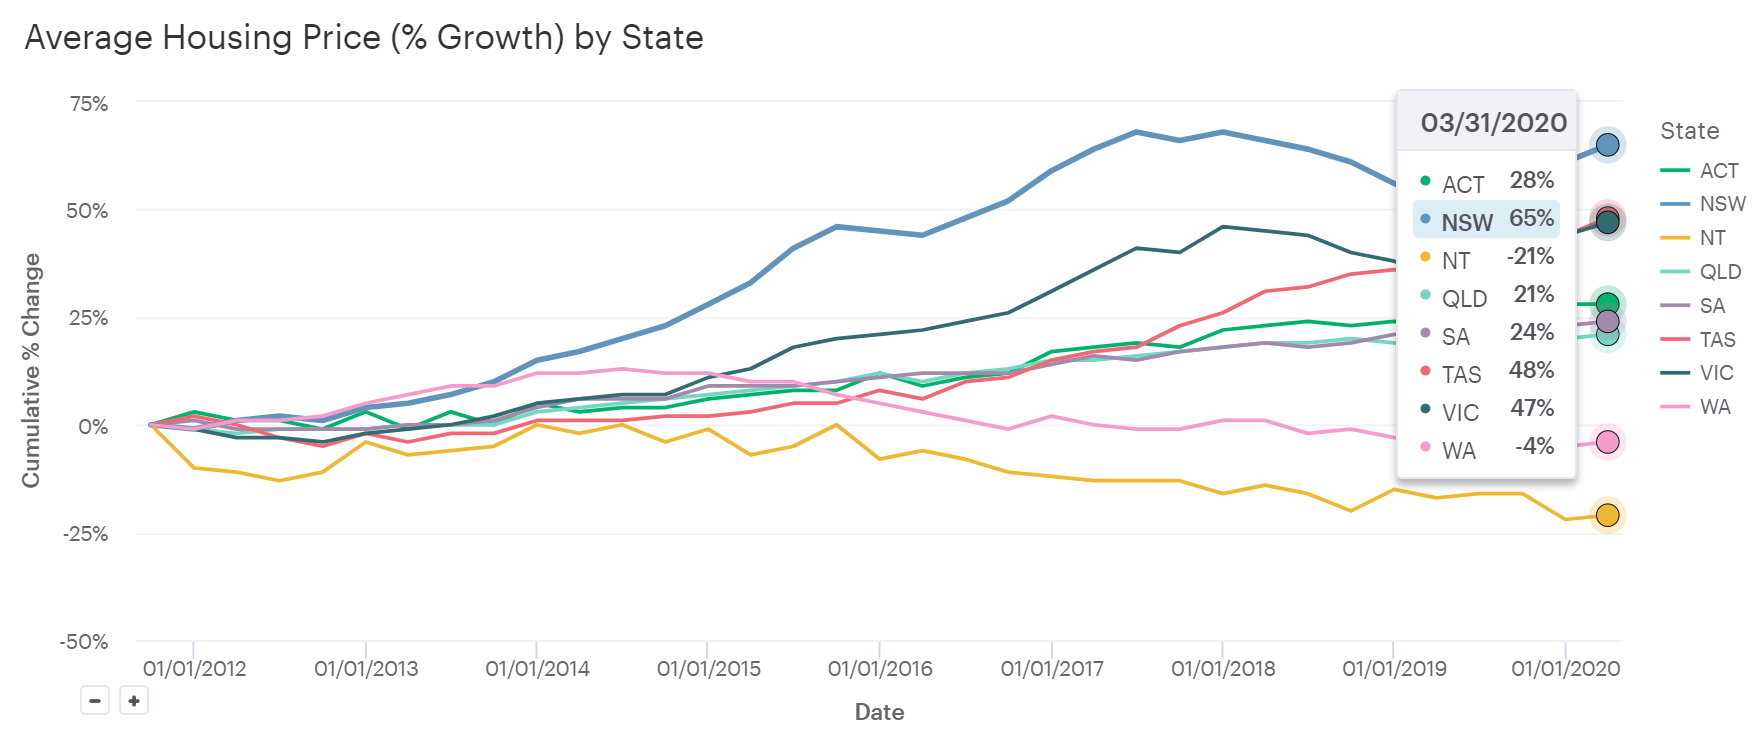 Average Housing Prices (Cumulative % Growth) by State
If you aggregate all the average housing prices for the whole nation, you get the following cumulative percentage growth nationwide:
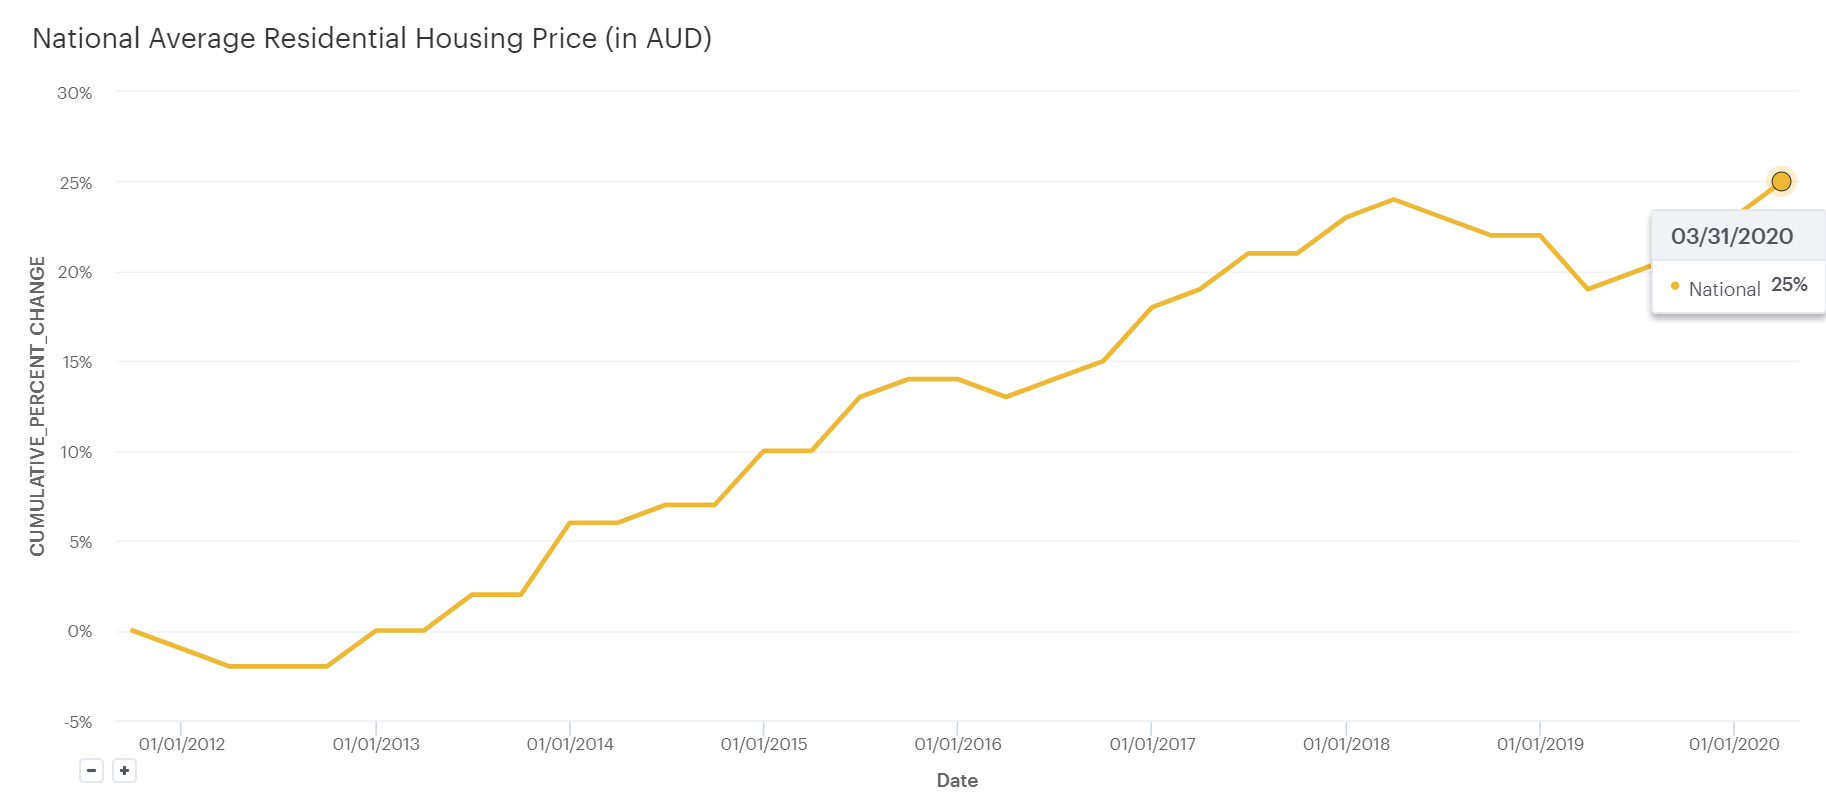 Australian Property Prices (Cumulative %)
A pretty modest growth when you look at it the nationwide level and it's clear that certain states like NSW are well above the national benchmark.
As a cross-check, let's analysis the the RRPI, which is good metric to see the price changes of the Australian housing market. As mentioned earlier, the reference price is 2011-12, so it will be '100' at that point in time:
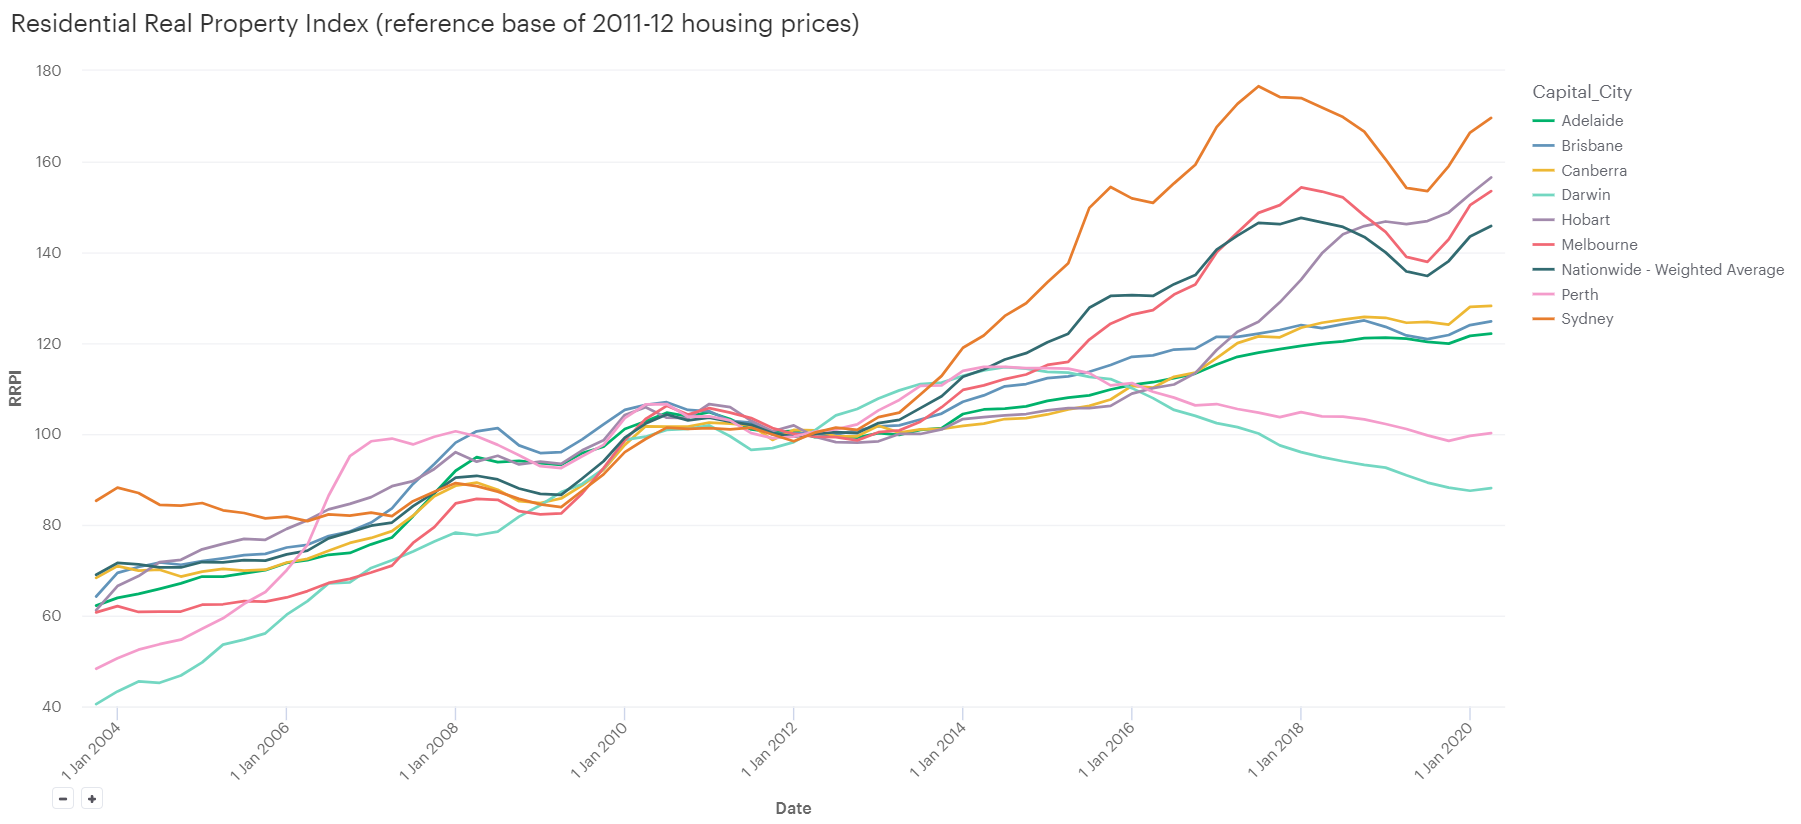 Australian Property Prices (Cumulative %)
You can see that the RRPI shows a greater growth, but generally the same as the average housing price metrics.
Australian Share Index Performance
As the housing price is reported at the end of every quarter, if it is not a trading day, the ASX will not have a closing price that day. Therefore, we had to get the closing price of the last trading day of every quarter:
Note I created the dimension date using my BYO Date Dimension Python script covered in my previous blog:
After doing the analysis using the above code, the results are as follows:
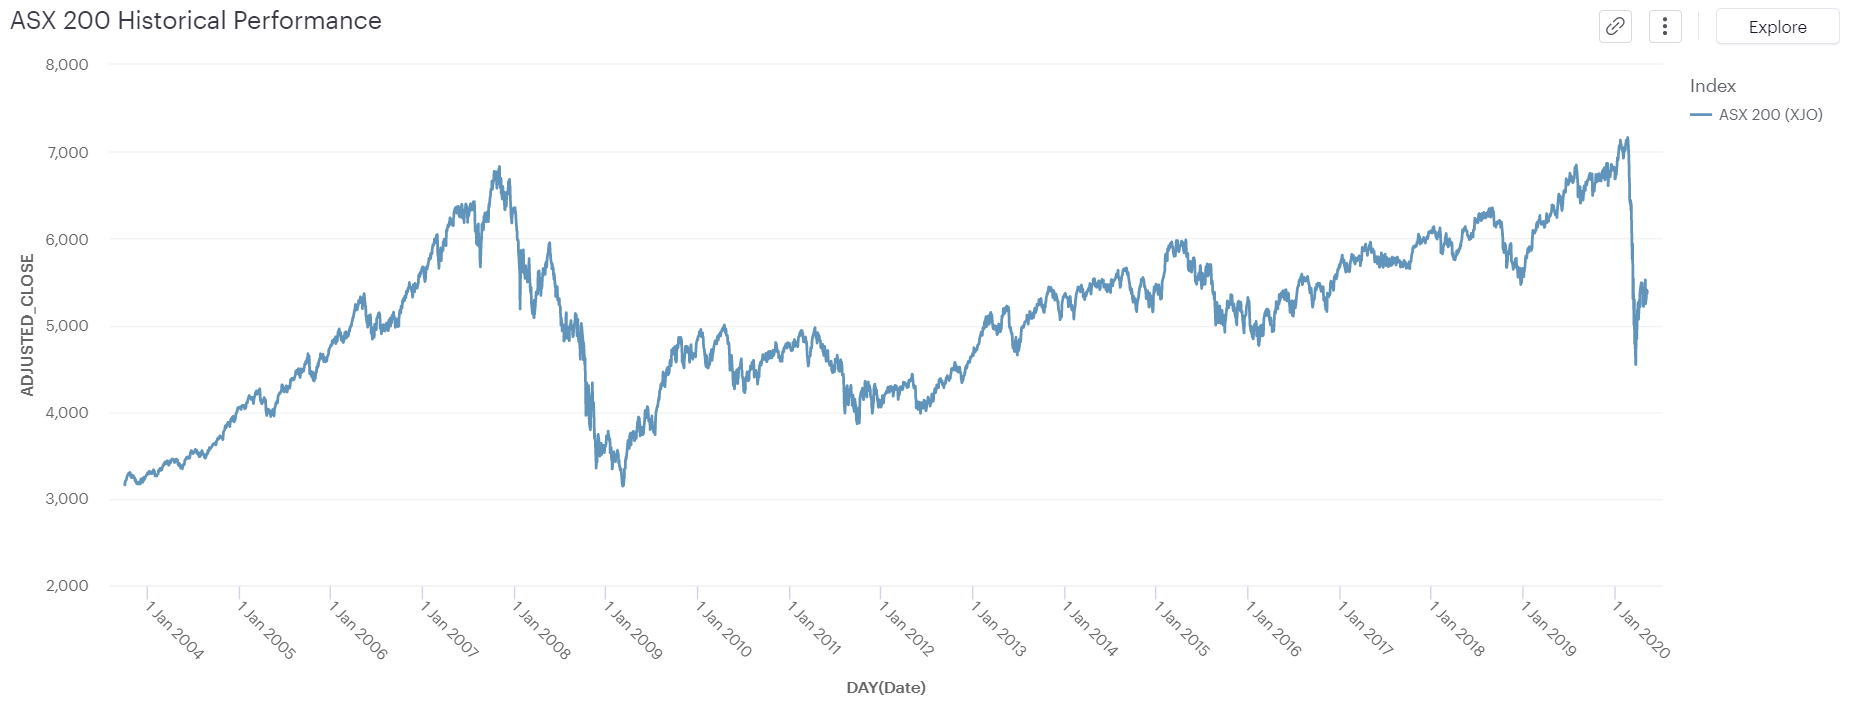 ASX Index Performance
You can see the overall adjusted close price is going up, with a big drop due to the global pandemic around March 2020. However, like before, we want to see the cumulative percentage growth so we can compare apples with apples later:
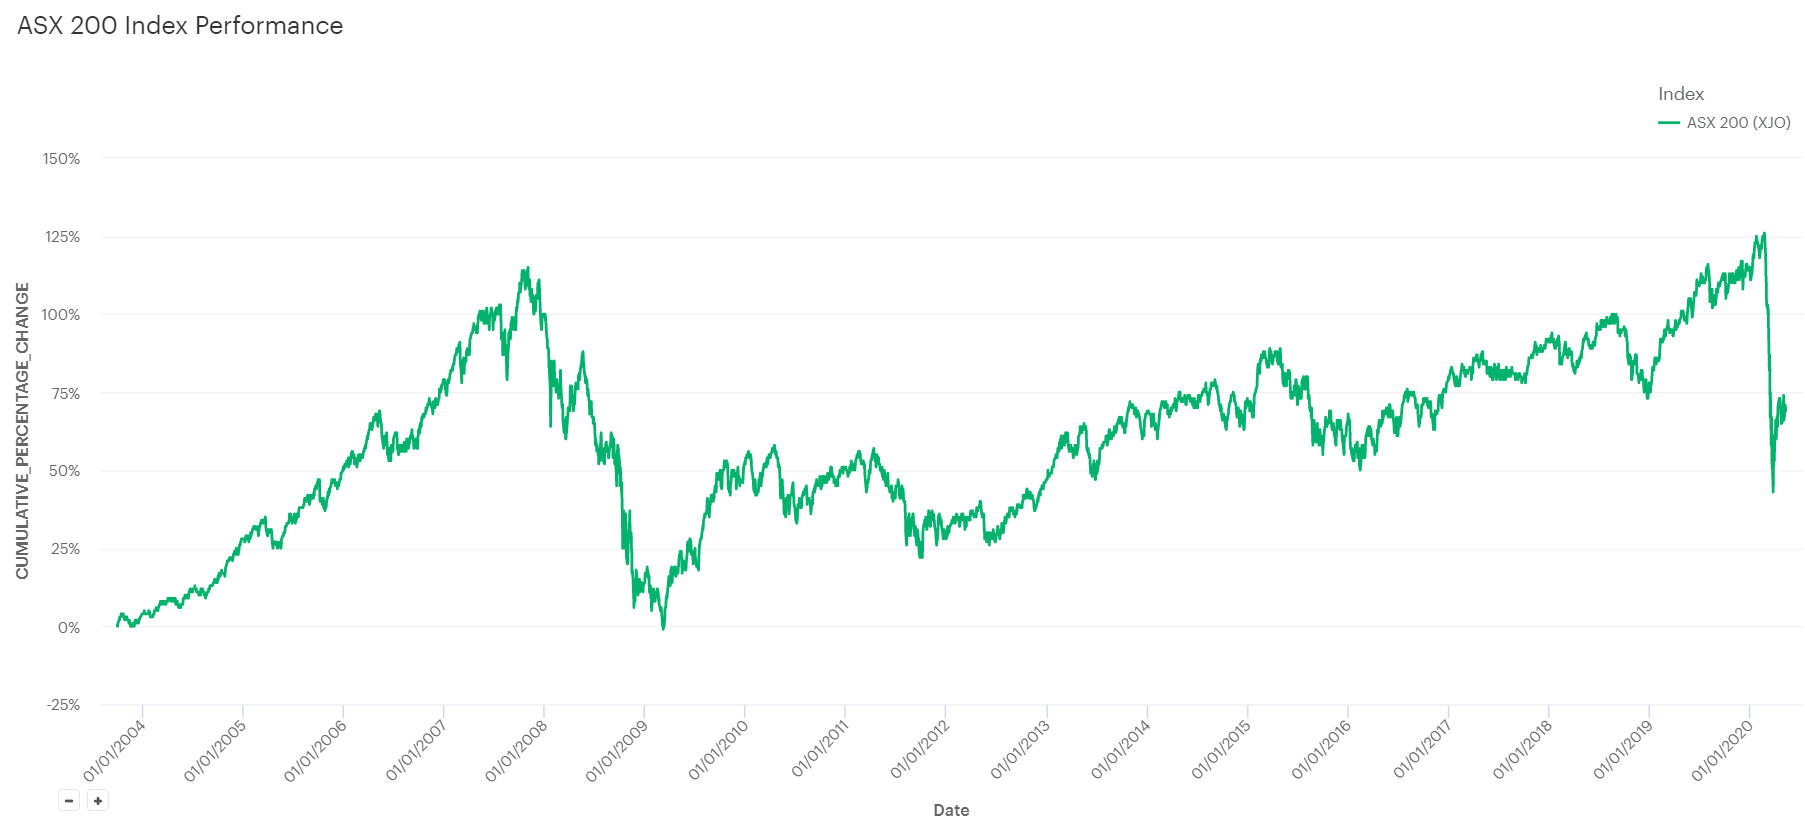 ASX Index Prices (Cumulative %)
Comparing Property vs Shares
Now for the final moment - comparing property vs share performance. As indicated earlier, to get a proper apples vs apples comparison, we need to compare the cumulative percentage growth of each investment.
If we do that, we get the following:
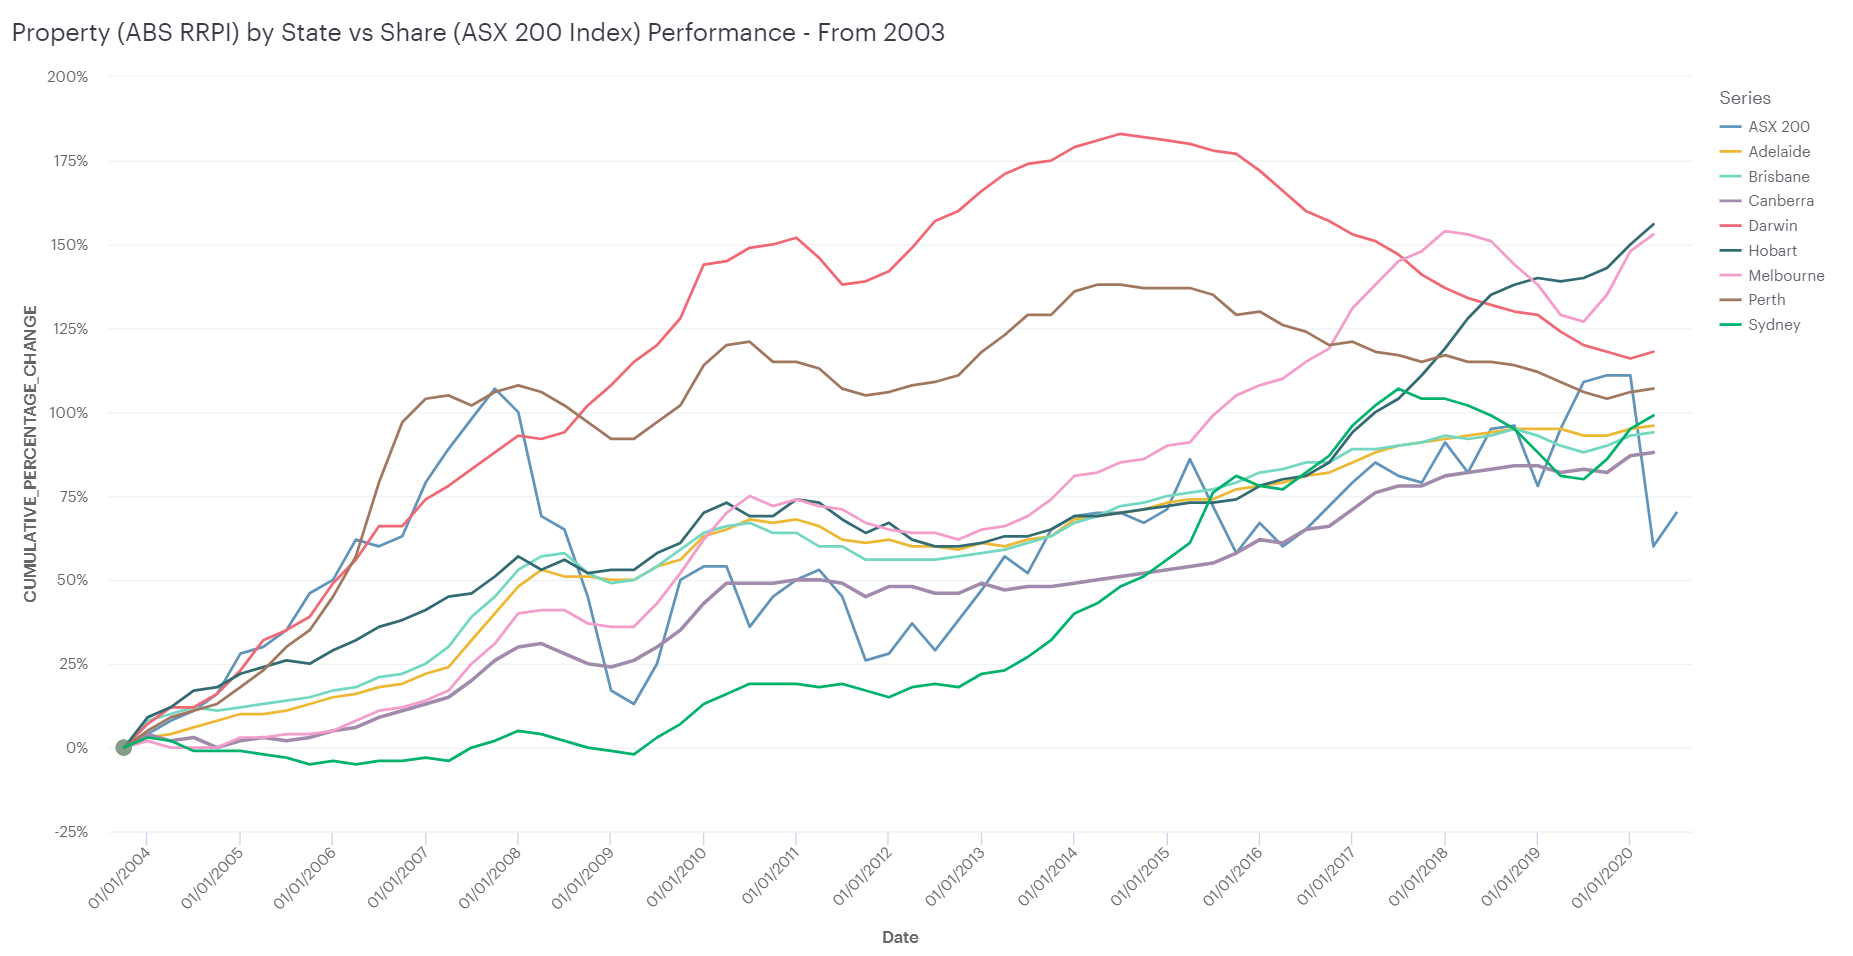 ASX Index vs RRPI Index (From 2003)
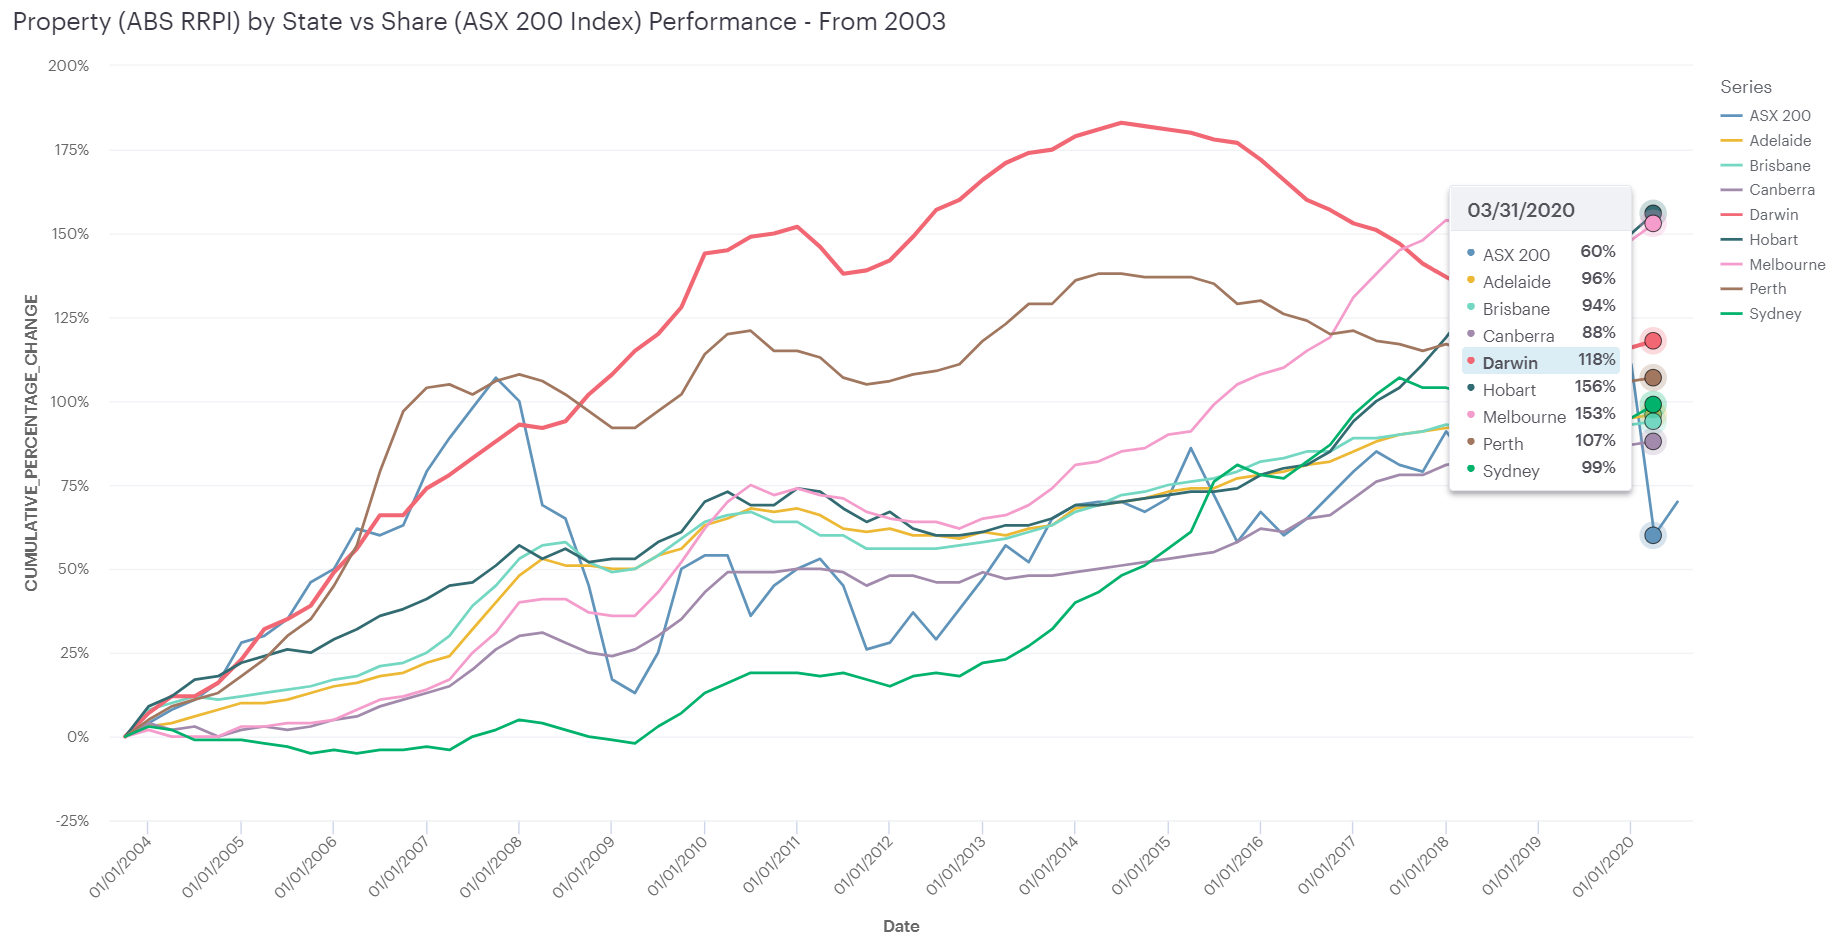 ASX Index vs RRPI Index (From 2003) with Highlights
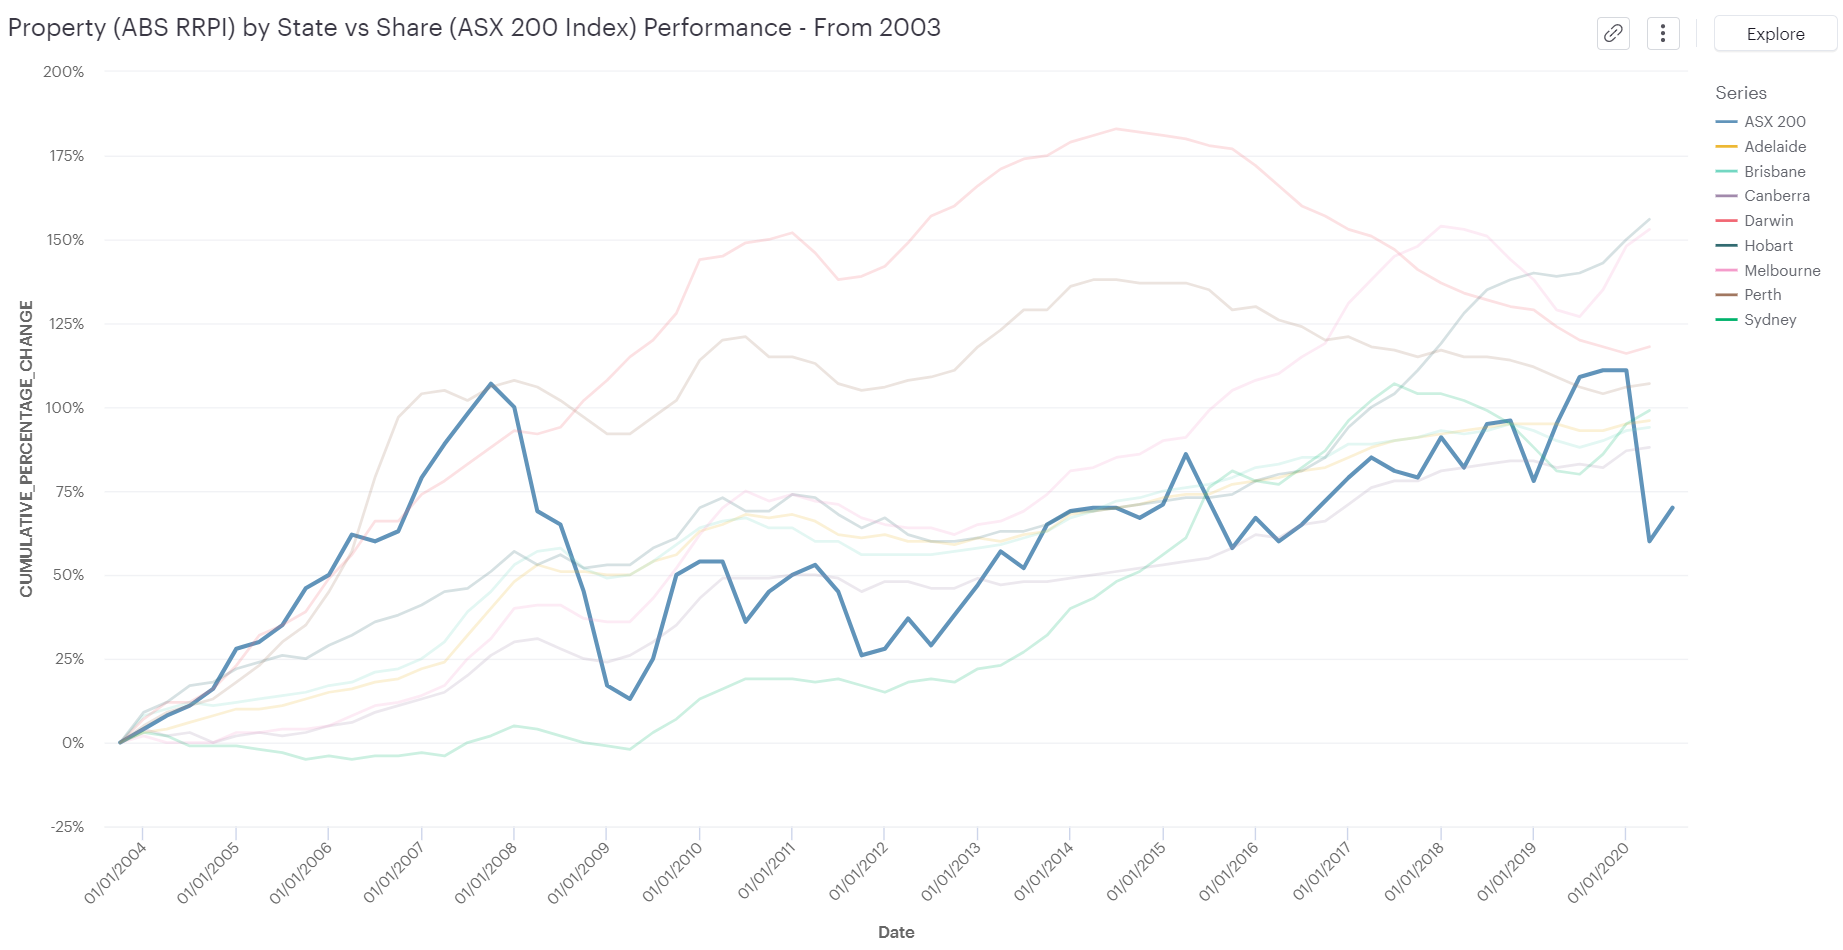 ASX Index vs RRPI Index (From 2003) with ASX Highlighted
I've highlighted the ASX Index performance to there are quite a few points where certain capital cities outperform the ASX!
Timing is everything!
However, timing is everything - if we entered the market in 2011 instead of 2003, the story would be totally different:
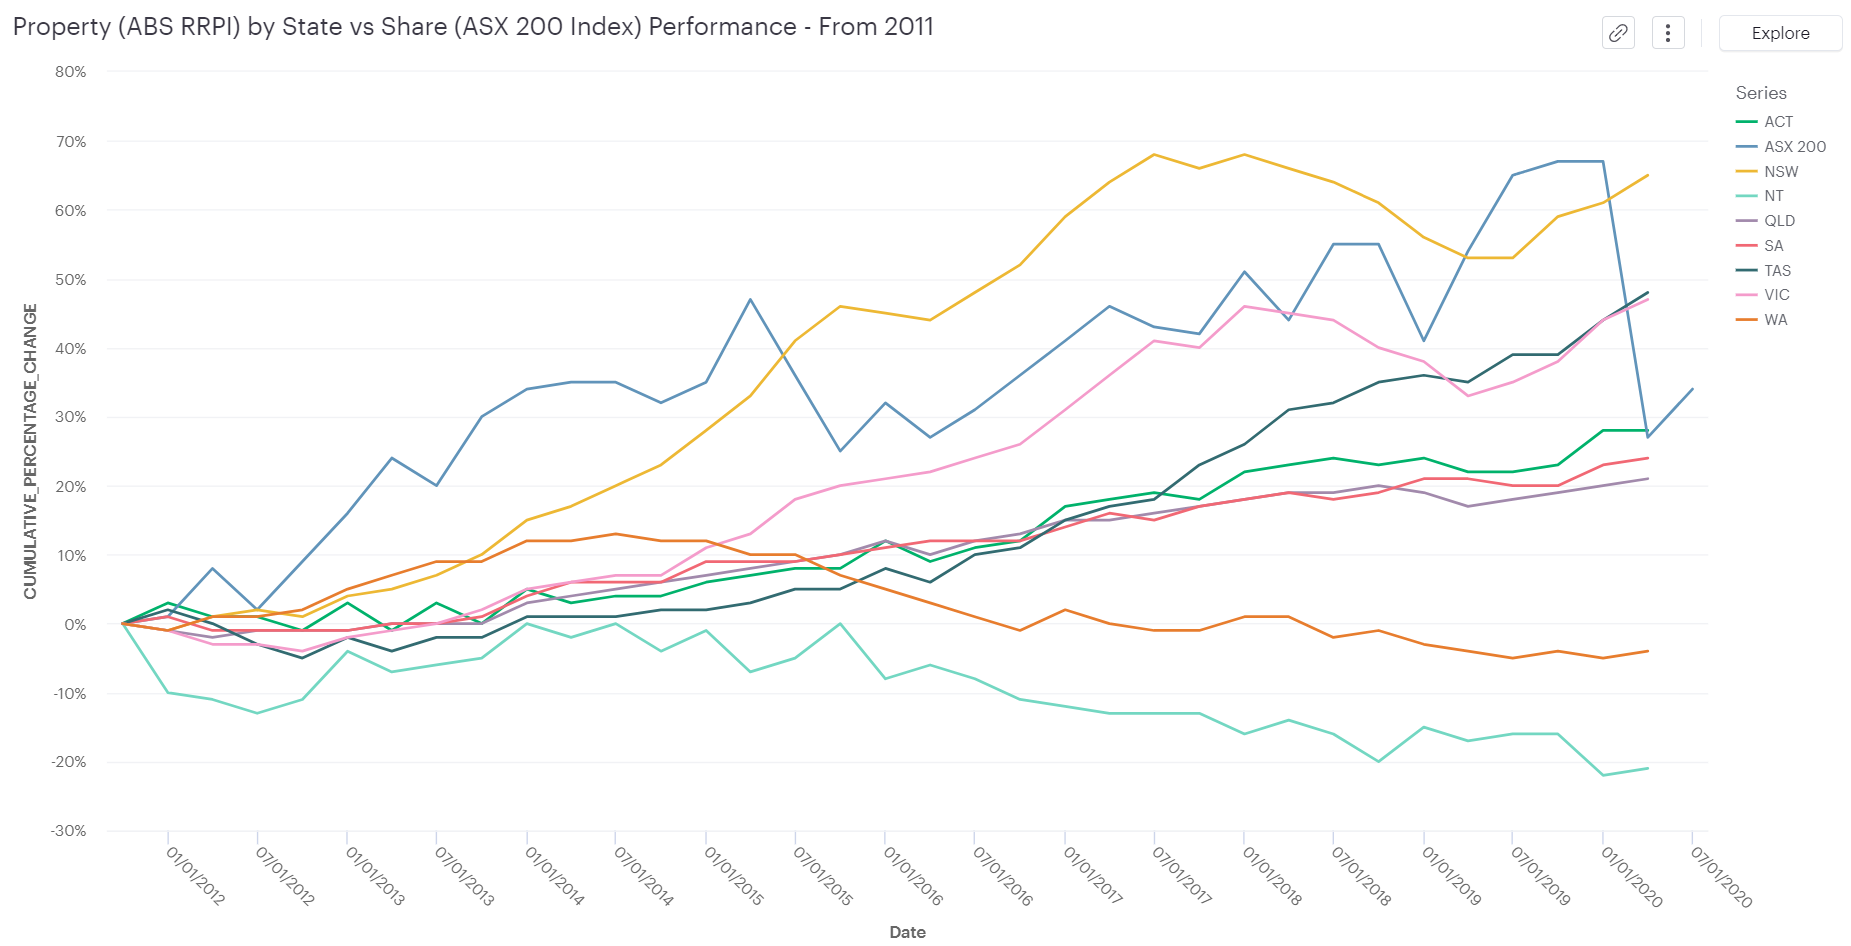 ASX Index vs RRPI Index (From 2011)
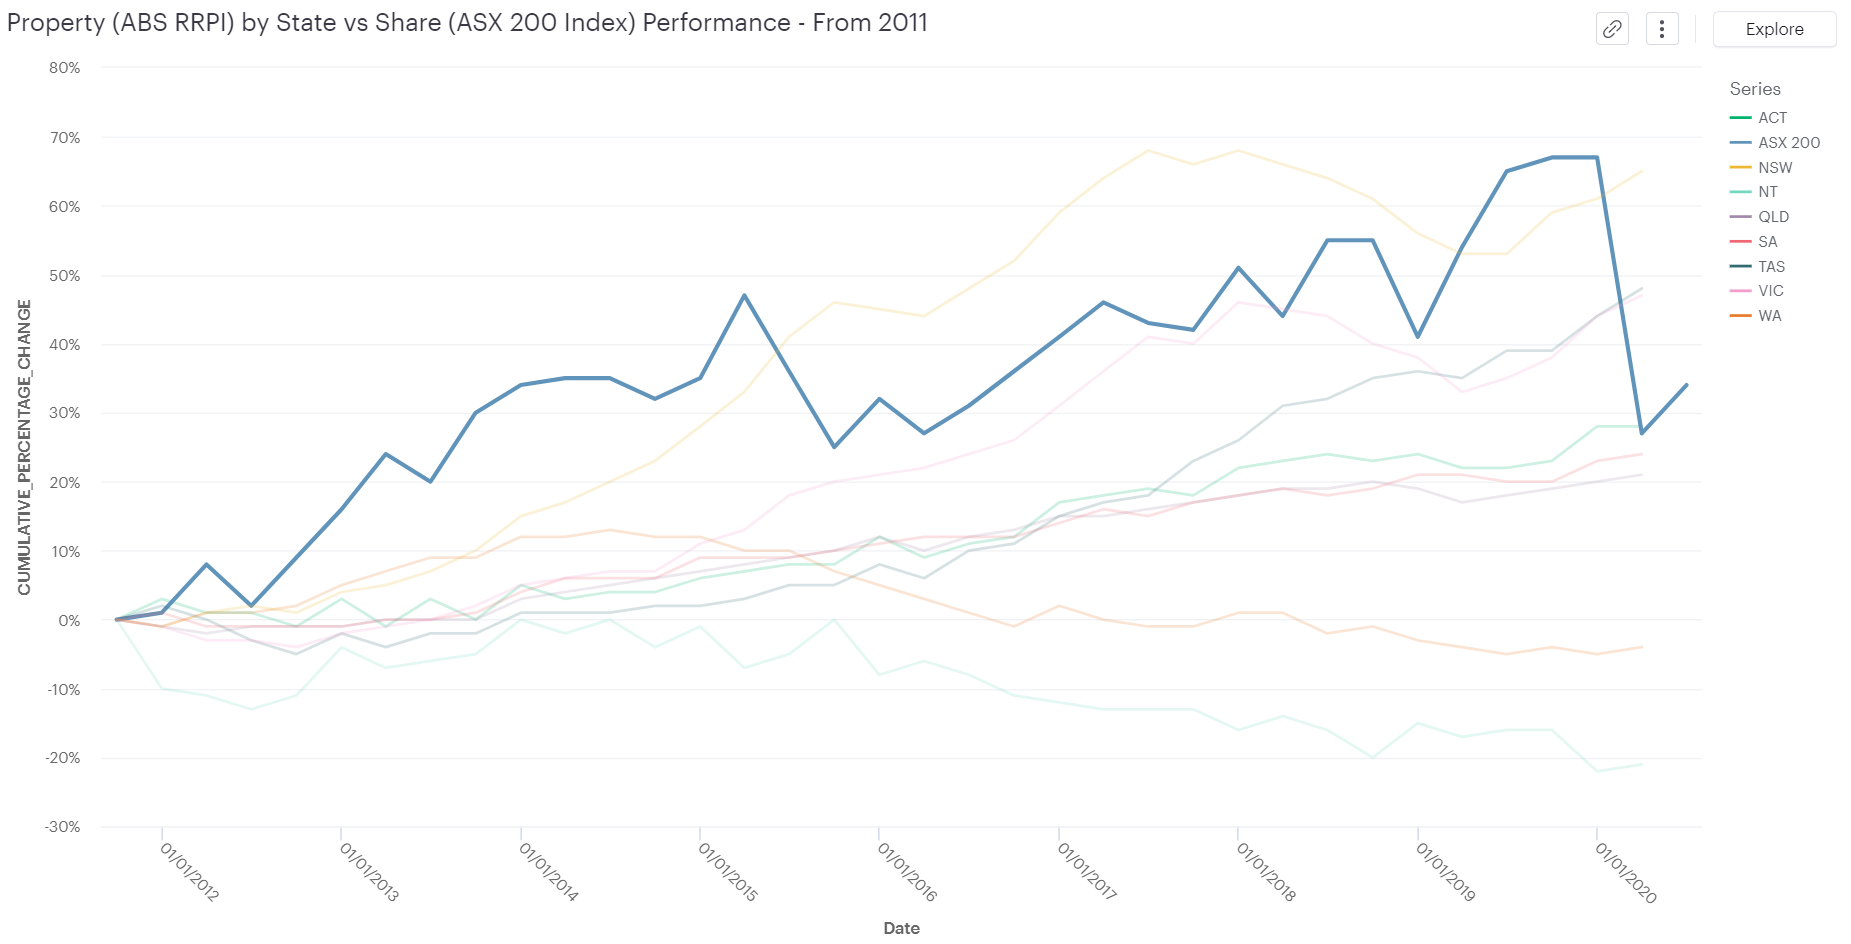 ASX Index vs RRPI Index (From 2011) with ASX Highlighted
You can see the entry point changes the analysis! Now you can see the performance of property in most capital cities isn't that good.
Furthermore, if the exit point was 31 December 2019, then the ASX 200 outperforms most cities, except Hobart, Melbourne and Darwin:
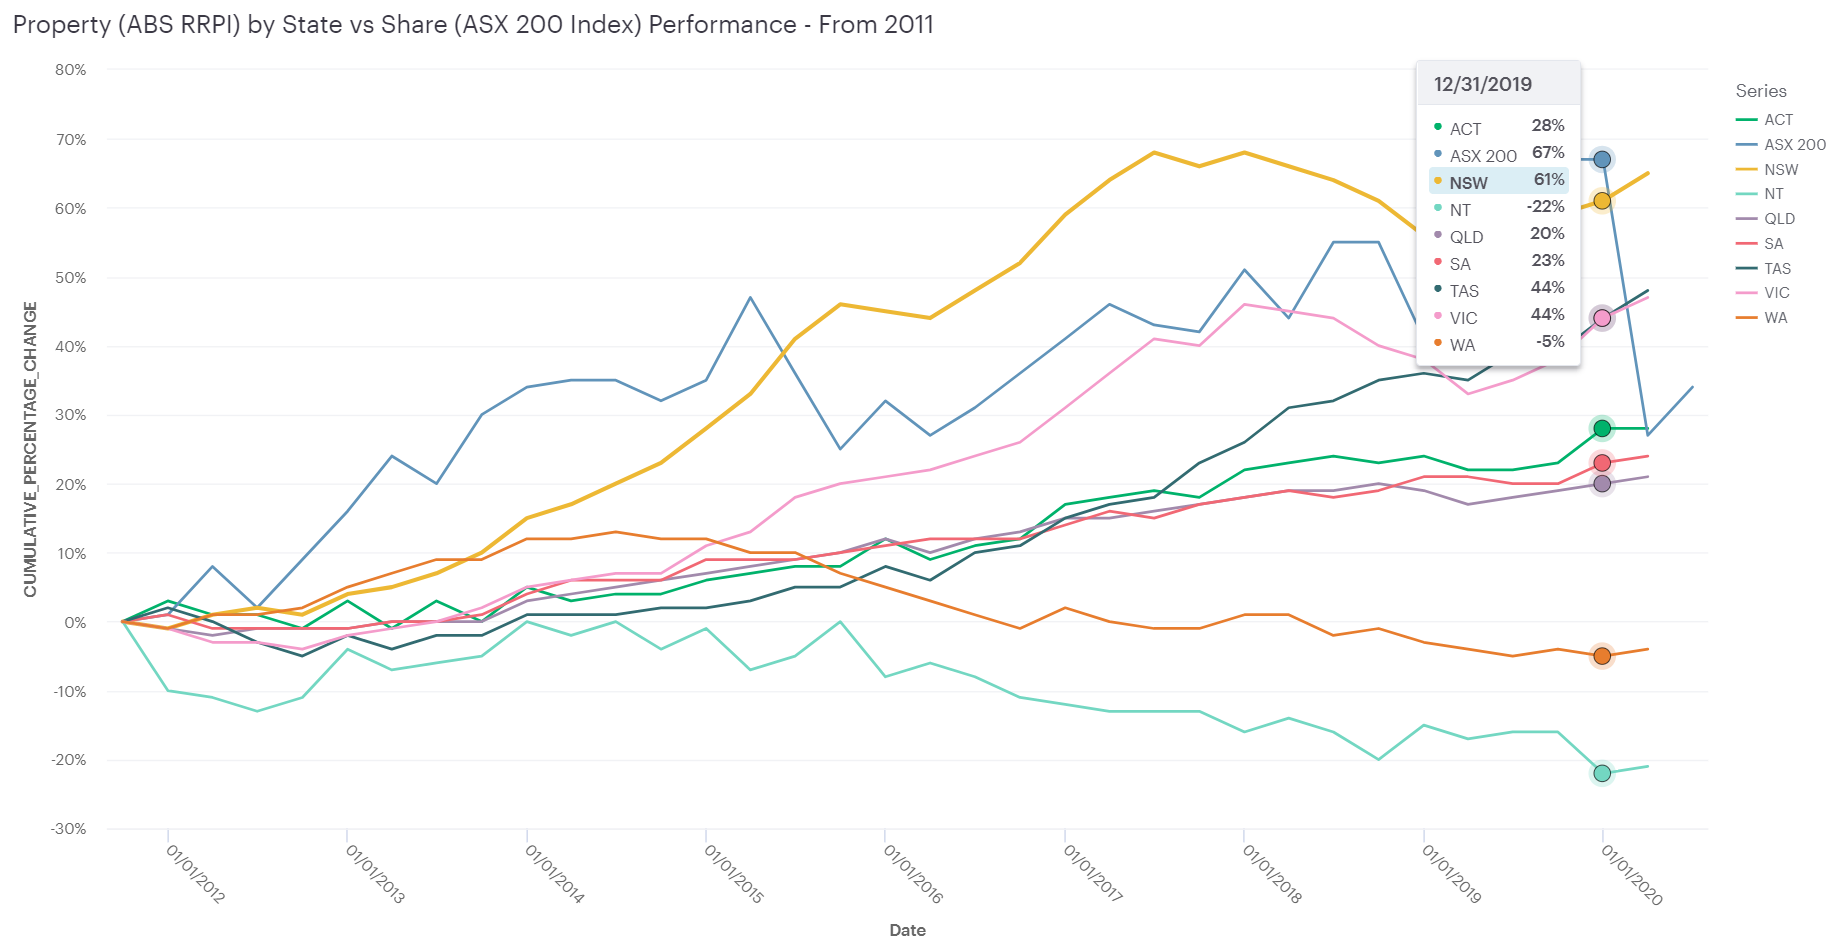 ASX Index vs RRPI Index (From 2011) with ASX Highlighted
However, if you look exited the market, say 31 March 2020, the ASX definitely did not perform better, in light of the big fall due to the ongoing global pandemic.
A comparison closer to home
I'll have a peek at my hometown property prices now - i.e. ASX 200 vs Brisbane property growth.
Scenario 1 - entered the market in 2003
As shown in the comparison graph below, you can see some points where shares were better performing and some years where property was better performing.
If you had exited the market in December 2019 you would be better off with shares, but March 2020 maybe not so much:
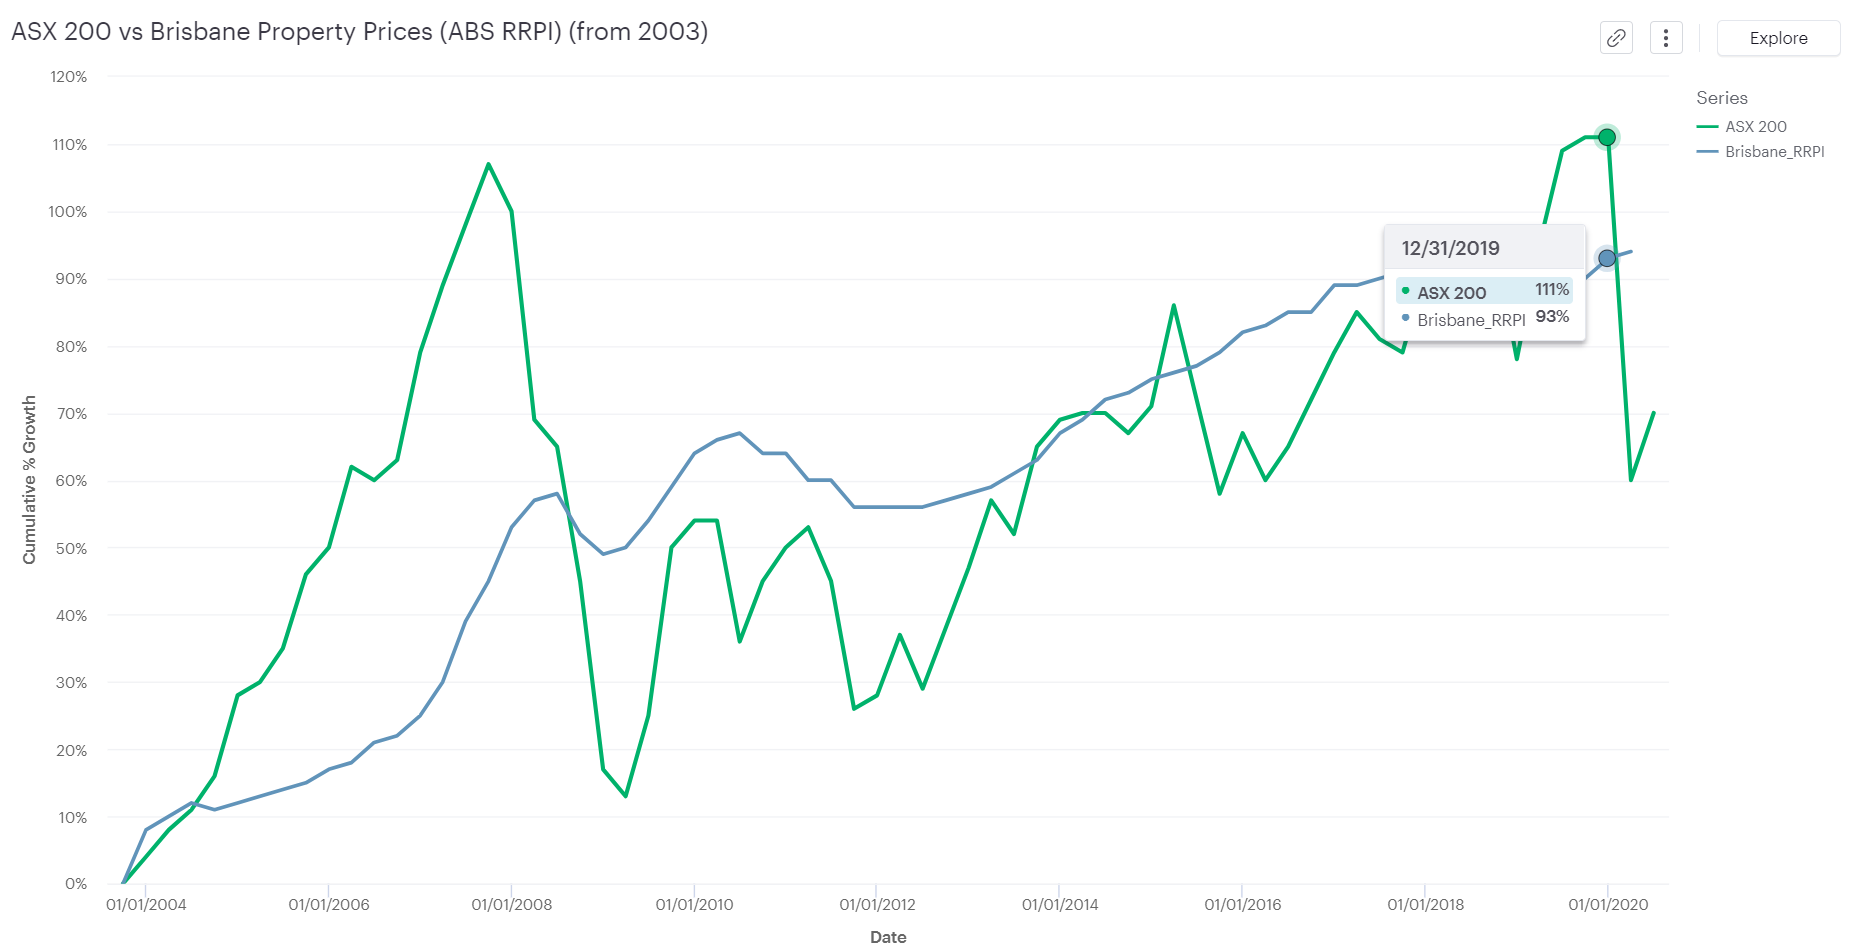 From 2003 (exit point 2019)- Cumulative percentage growth - Brisbane (RRPI) vs ASX 200
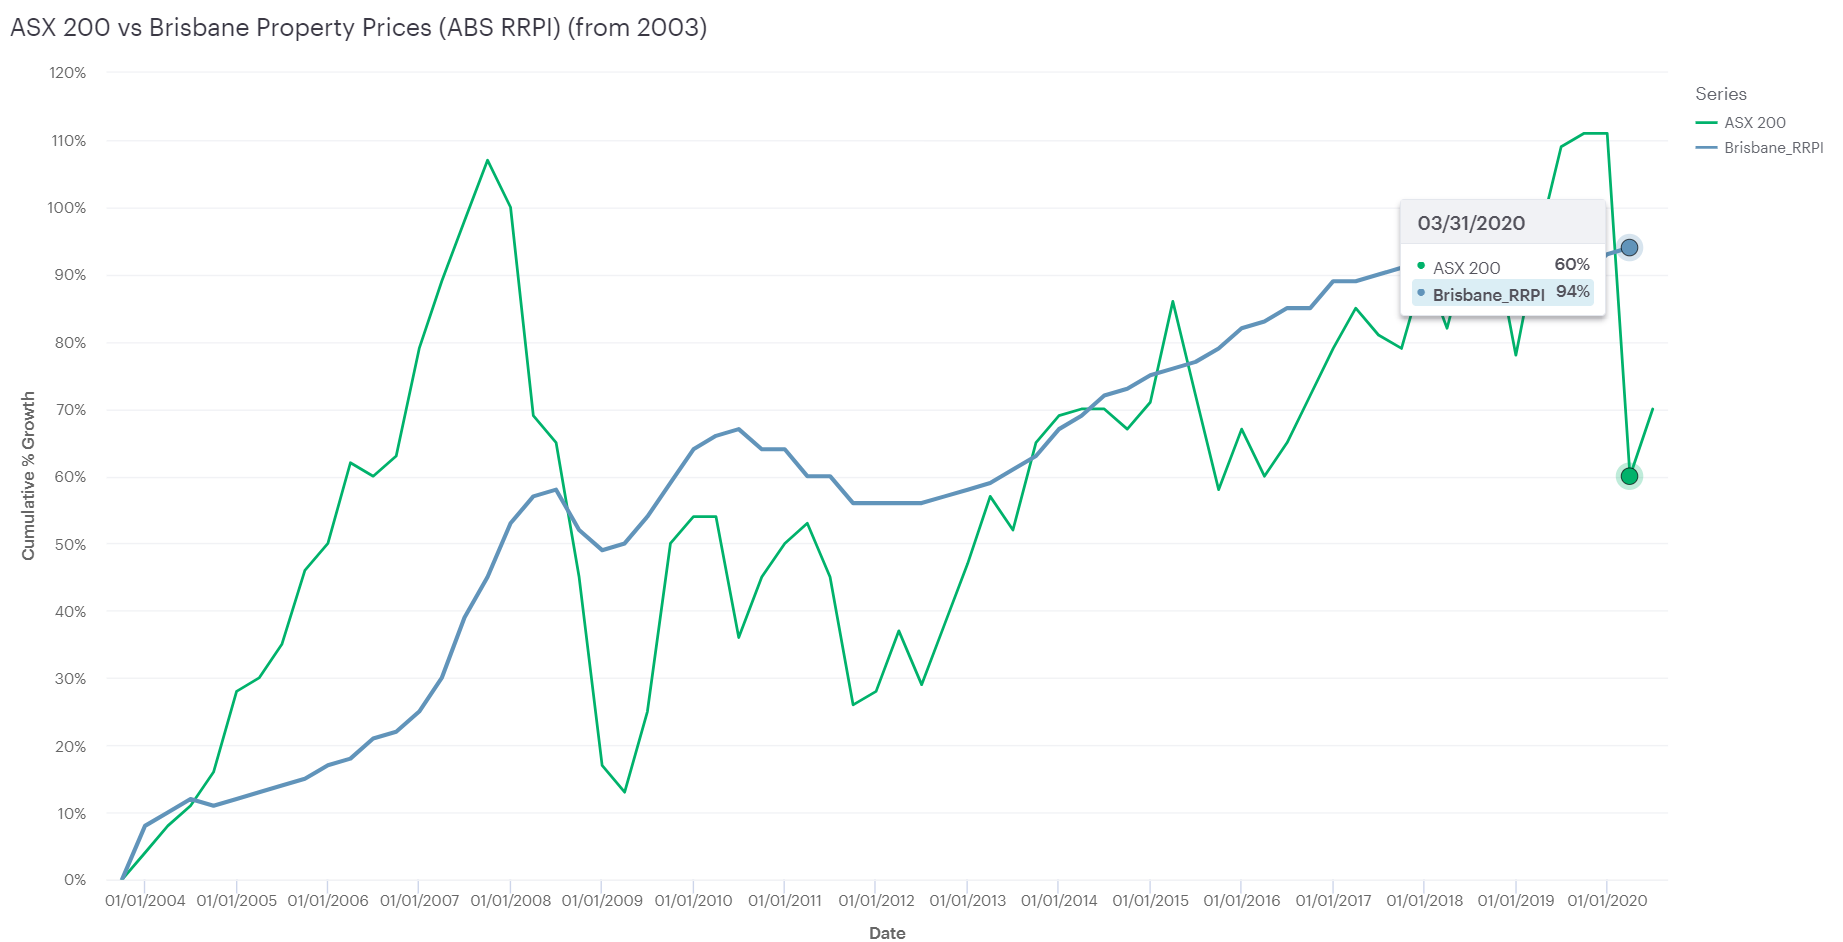 From 2003 (exit point 2020) - Cumulative percentage growth - Brisbane (RRPI) vs ASX 200
Scenario 2 - entered the market in 2015
As shown in the comparison graph below, if you had entered in 2015, then:
- if you had exited in 31 December 2019, then you would be better off with shares
- if you had exited in 31 March 2020, then you would be better off with property
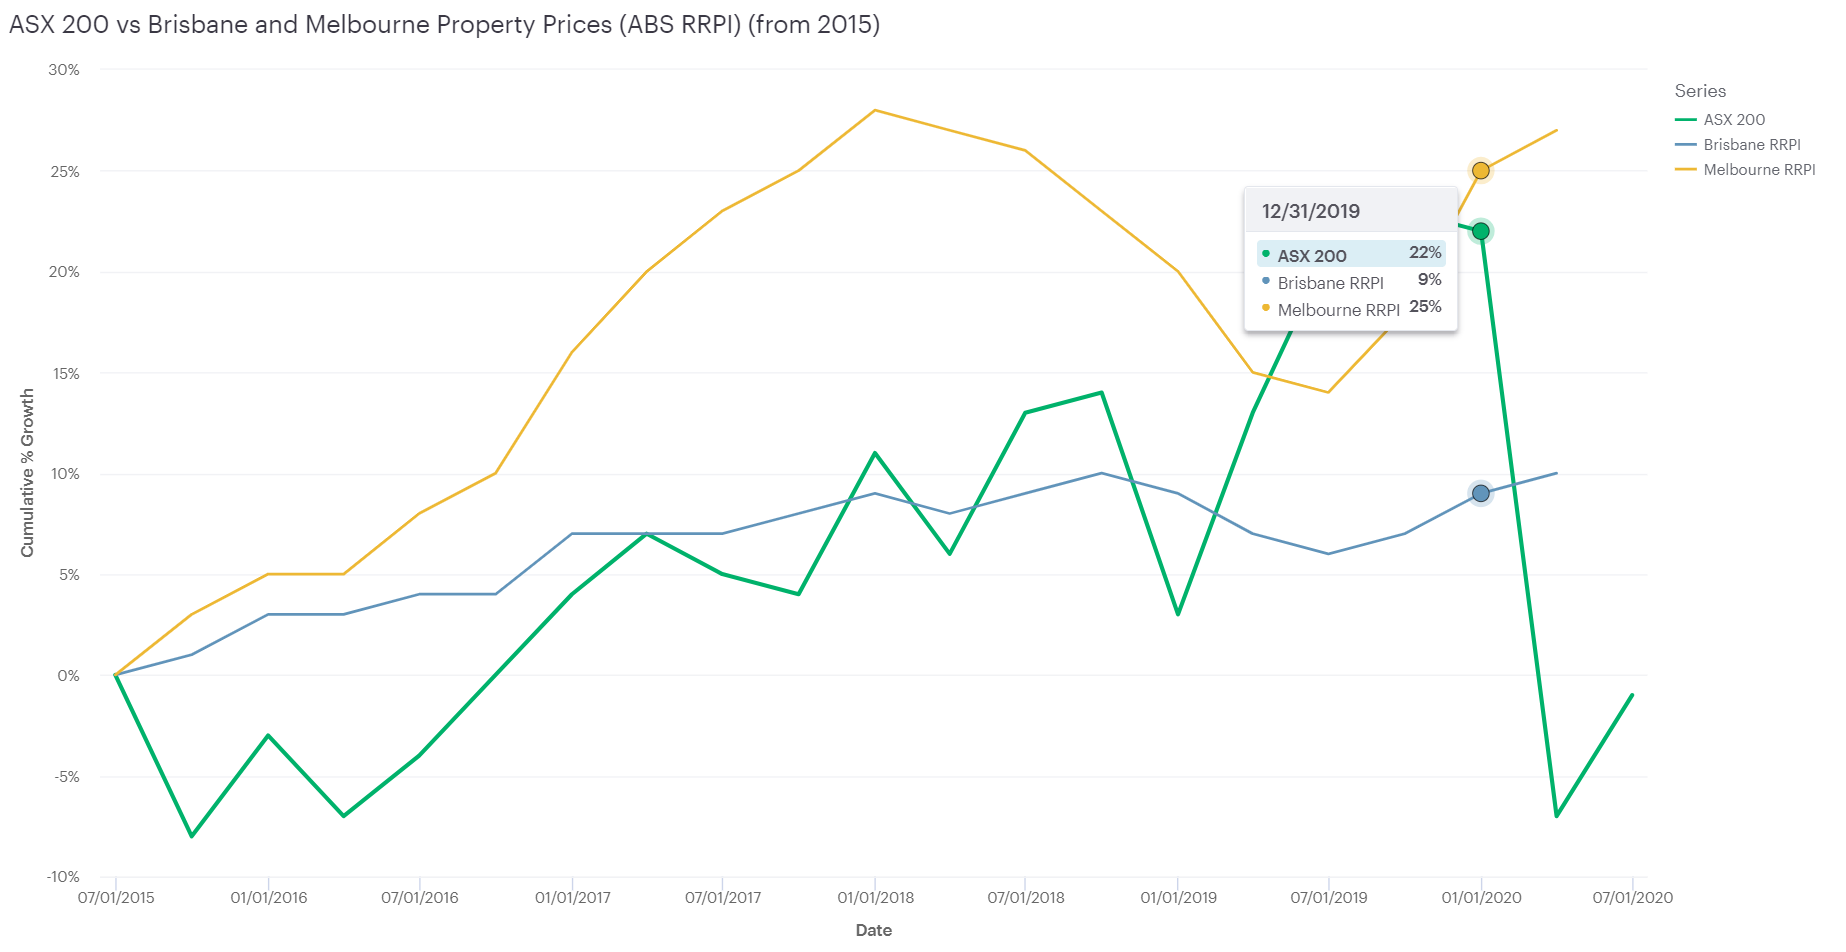 From 2015 (with 2019 exit point) - Cumulative percentage growth - Brisbane/Melbourne (RRPI) vs ASX 200
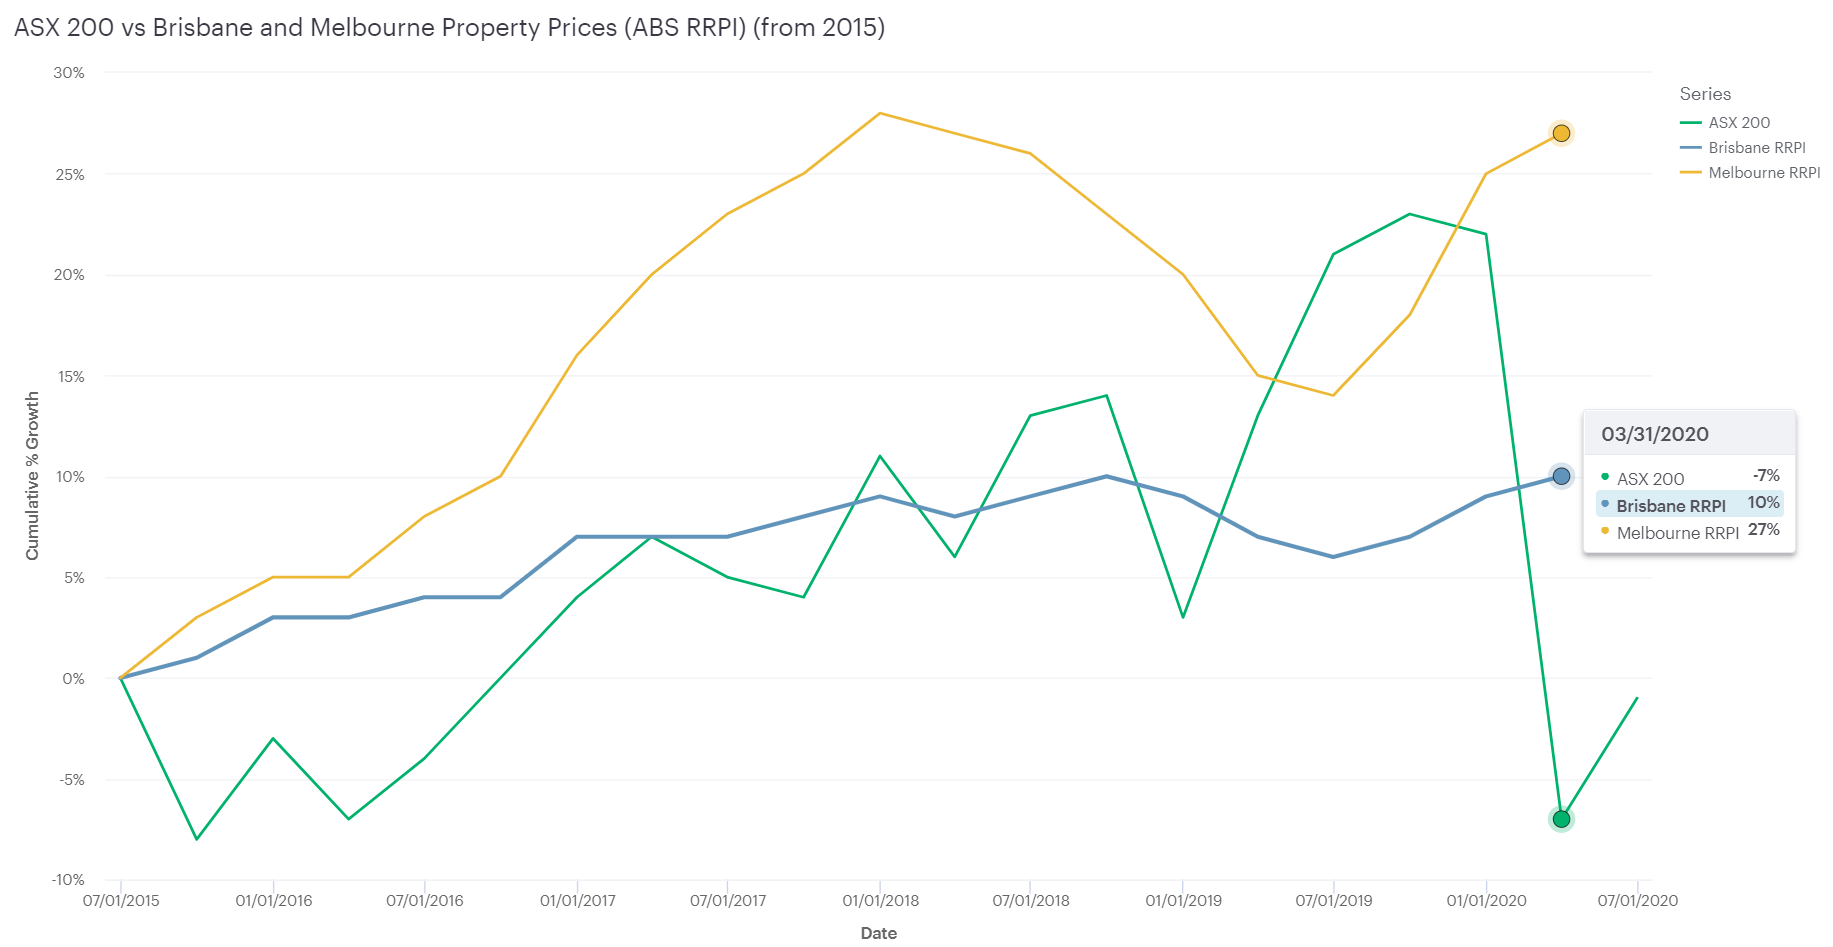 From 2015 (with 2020 exit point) - Cumulative percentage growth - Brisbane/Melbourne (RRPI) vs ASX 200
Closing Thoughts - we have a winner?
So now you've seen the data analysis and the figures, the winner is:
No clear winner...
It does prove one thing - investment always has an element of uncertainty, but timing is everything!
It is yet to be seen whether the effects of the global pandemic will affect property prices, as the property market generally responds slower than the share market (its less liquid after all). The next round of data will be released in mid-September 2020.
 Hooray!
Photo by nickgesell from Pixabay
Hooray!
Photo by nickgesell from Pixabay